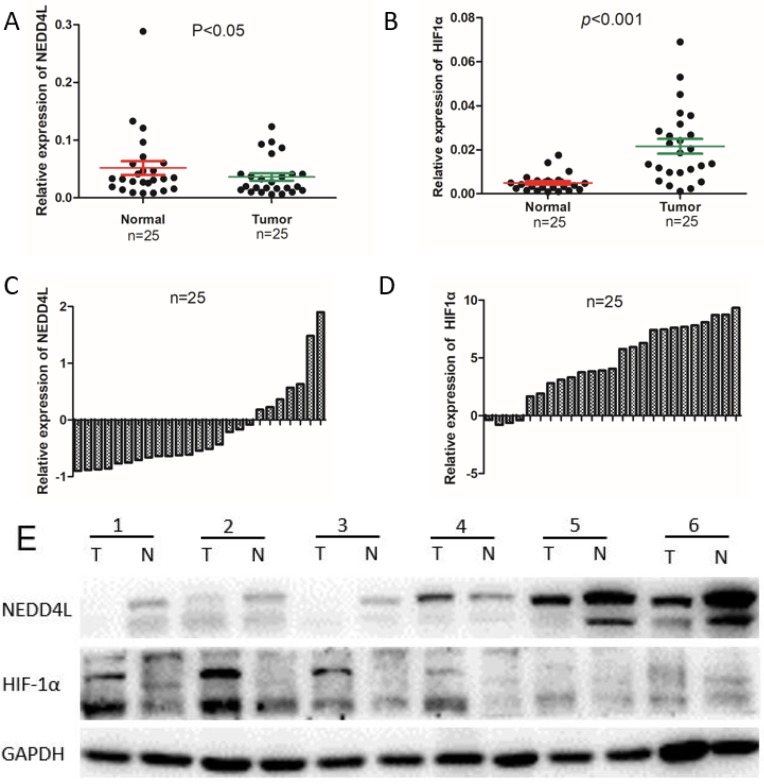
Figure 1.
The mRNA and protein expression level of NEDD4L and HIF1α in clinical samples. Scatter plots of the relative expression of NEDD4L (A) and HIF-1α (B) mRNA in tumor and normal tissues. Bar plots of NEDD4L (C) and HIF-1α (D) expression in GC tissues compared with corresponding normal tissues. In each patient was presented as the log2 ratio of tumor tissue/normal tissue. (E) The protein expression level of NEDD4L and HIF-1α were analyzed by western blot assay.Representative protein expression level of NEDD4L and HIF-1α in 6 pairs of tumor (T) and corresponding normal tissues (N).

