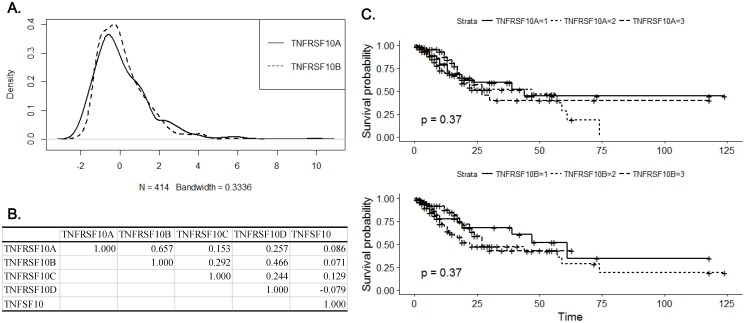
Figure 2.
Analysis of DR4 and DR5 expression in gastric cancer tissue with RNASeq results in TCGA database. (A) A Kernel density plot represents distribution of median z-score of DR4 (TNFRSF10A) and DR5 (TNFRSF10B) expression in gastric cancer tissue. (B) A table of correlation coefficients among DRs, DcRs (TNFRSF10C and TNFRSF10D) and TRAIL (TNFSF10). (C) Kaplan-Meier plots for overall survival according to expression of DR4 (upper panel) and DR5 (lower panel). Solid lines represent for expression lower than the first quartile, dotted lines for expression between the first and third quartile and dashed lines for expression higher than the third quartile, respectively.

