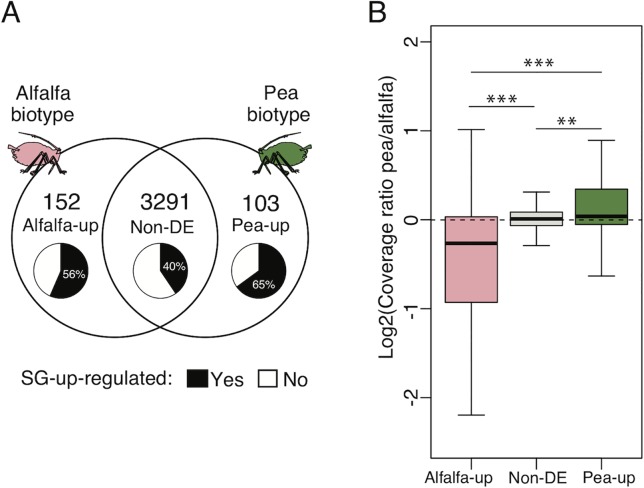
Figure 3.
Candidate salivary effector genes in pea and alfalfa biotypes and their genome sequence coverage. (A) The 3,546 candidate salivary effector genes identified from salivary glands of LSR1 and P123 were categorized in three groups based on their DE patterns in the head samples of the alfalfa and pea biotypes. 152 salivary genes were upregulated in the alfalfa biotype, and 103 genes were upregulated in the pea biotype, while 3,291 genes were not differentially expressed. The pie charts indicate the proportions of salivary effector genes showing upregulation in SGs compared with ATs in at least one of the reference aphid lines, LSR1 or P123. (B) Genome sequence coverage ratio (pea/alfalfa) of salivary genes was determined by mapping of pool-seq reads on the LSR1 genome. Asterisks indicate statistical differences after Mann-Whitney tests between alfalfa-up, pea-up, and non-DE salivary effector subsets (**P < 0.01, ***P < 0.001).

