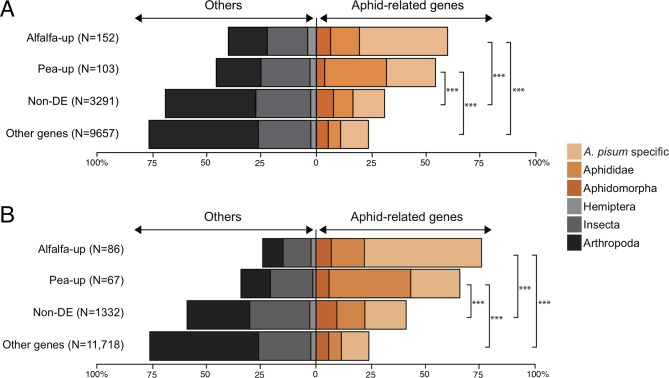
Figure 4.
Orthology profiles of candidate salivary (A) and salivary upregulated (B) effector sets. Proportions of the different orthologous categories in the salivary effector sets and the other A. pisum genes that were considered as expressed in this study are shown. Asterisks indicate the significance of differences in the proportion of genes that belong to the same orthologous categories (proportion test, ***P < 0.001). Orthologous categories were assigned by Boulain et al. (2018), based on an OrthoDB analysis using 17 insect genomes.

