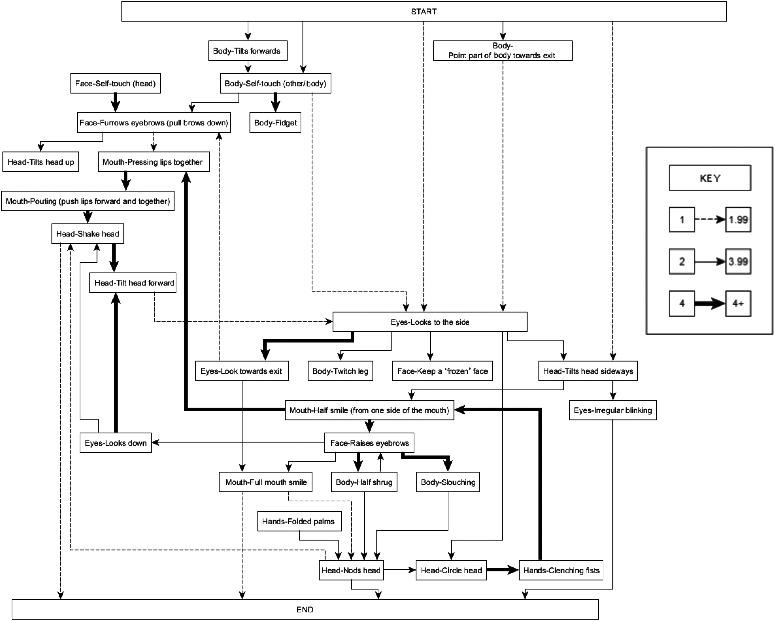
Figure 1.

Sequence analysis of behaviours shown by Cluster A individuals.
Note: All transitions are significant (p < .05); key indicates line thickness related to standardised residuals.

Sequence analysis of behaviours shown by Cluster A individuals.
Note: All transitions are significant (p < .05); key indicates line thickness related to standardised residuals.