
Figure 3.
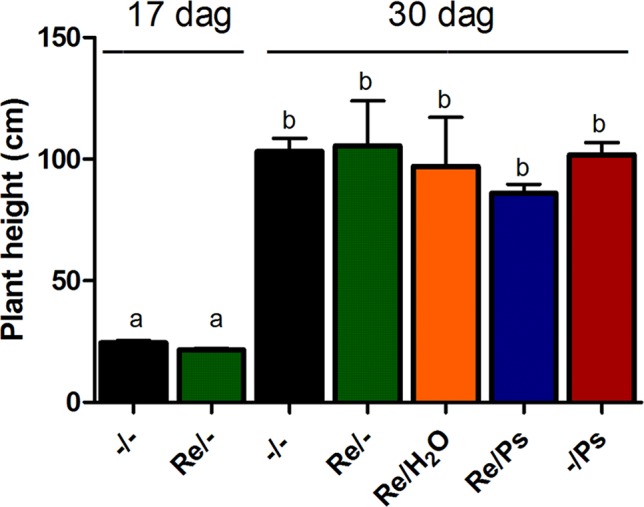
Plant height before pathogen inoculation and 13 days after infection (17 and 30 dag, respectively). Data are mean ± SEM from 24 independent (n = 24) plants per treatment, from two independent experiments, and were analyzed with one-way ANOVA followed by Tukey’s multiple comparison tests (P < 0.05). Means with the same letter are not significantly different.