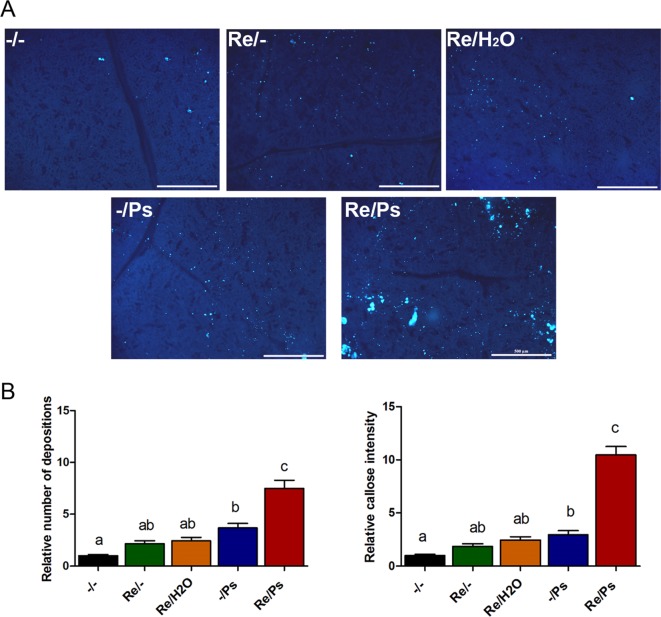
Figure 7.
Phenotype of R. etli-induced callose in F0 generation. (A) Morphological differences of callose depositions in 17 days-old P.vulgaris plants (co-cultivated with the symbiont), after PspNPS3121 infection. Representative photographs of aniline blue-stained leaves under UV epifluorescence illustrate differences in callose deposition between treatments. (B) Relative quantification of callose (number of individual depositions per unit of leaf surface) and callose intensity (number of fluorescent callose-corresponding pixels relative to the total number of pixels) were determined by using the Fiji software (according to Jin and Mackey, 2017). Values represent means (±SEM, n=24). Statistical significance was determined using one-way ANOVA followed by Tukey’s multiple comparison test, p < 0.05). Scale bar = 500 µm. Means with the same letter are not significantly different.

