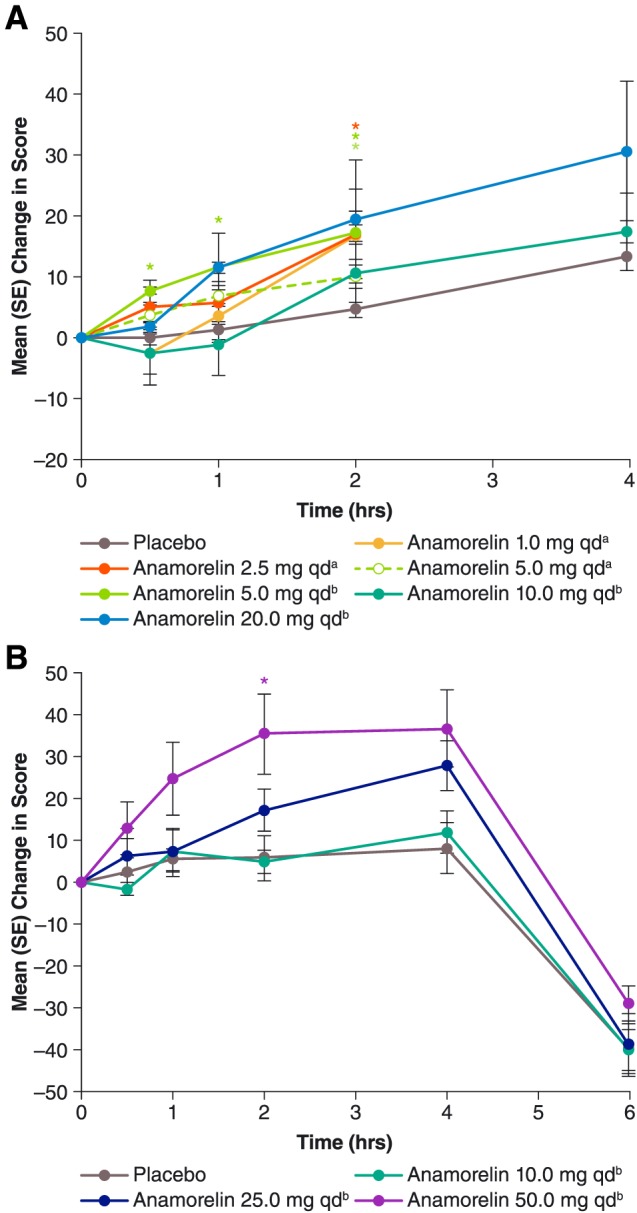
Figure 2.

Mean [standard error (SE)] post‐dose changes in visual analogue scale scores for anticipated eating pleasure during Study 102 (A, top chart) and Study 101 (B, bottom chart). For each curve, n = 6, except for anamorelin 20 mg once daily (qd) in Study 102 (n = 5), placebo in Study 102 (n = 12 except at 4 h, where n = 4), and placebo in Study 101 (n = 9). aAdministered as a solution. bAdministered in capsules. *P < 0.05 vs. placebo, paired t‐test.
