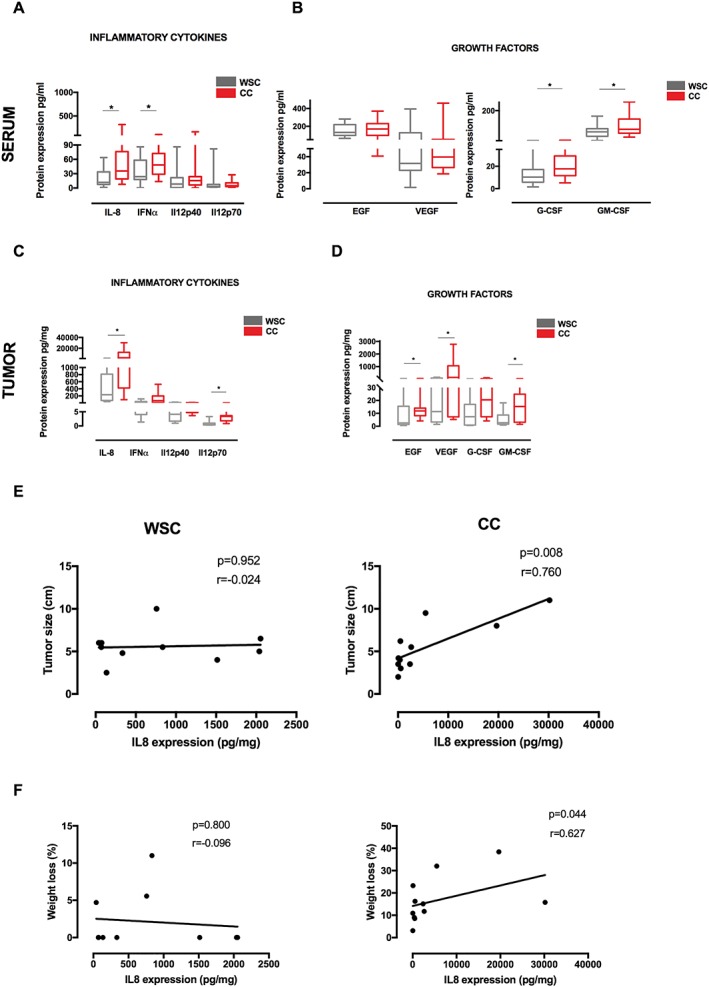
Figure 2.

Inflammatory cytokines and growth factors in cachectic patients. Data were expressed as mean ± standard deviation or as median [first quartile; third quartile]. *Significant difference between the groups was tested using Mann–Whitney U test (P < 0.05). Pearson correlation analysis was employed between groups. (A) Protein expression of circulating inflammatory cytokines in serum of patients. (B) Protein expression of growth factors in serum of patients. Protein concentration in pg/mL of total protein. (C) Protein expression of inflammatory cytokines in tumour biopsies of patients. (D) Protein expression of growth factors in tumour biopsies of patients. Protein concentration in pg/mg of total protein. (E) Correlation between tumour size and interleukin (IL)‐8 expression in tumour. (F) Correlation between percentage of weight loss and IL‐8 expression in tumour. EGF, epidermal growth factor; G‐CSF, granulocyte colony‐stimulating factor; GM‐CSF, granulocyte–macrophage colony‐stimulating factor; IFN‐α, interferon‐α; VEGF, vascular endothelial growth factor. Sample number in serum: weight‐stable cancer (WSC) (n = 18–23) and cancer cachexia (CC) (n = 18–23). Sample number in tumour analysis: WSC (n = 8–10) and CC (n = 9–11).
