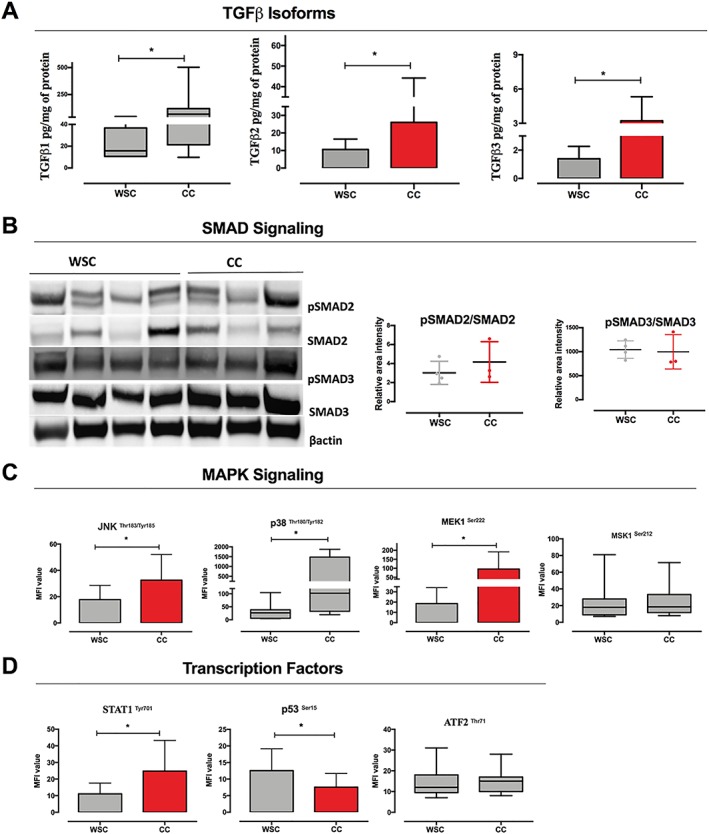
Figure 4.

Interaction between mitogen‐activated protein kinase (MAPK) and transforming growth factor (TGF)‐β signalling in cachexia. Data were expressed as mean ± standard deviation or as median [first quartile; third quartile]. *Significant difference between the groups was tested using unpaired t‐test and Mann–Whitney U test (P < 0.05). Protein concentration in pg/mL of total protein or medium fluorescent intensity (MFI). (A) Protein expression of TGF‐β isoforms [weight‐stable cancer (WSC): n = 7–10; cancer cachexia (CC): n = 7–10]. (B) Western blot analysis of phosphoSMAD2 (pSMAD2)/SMAD2 and phosphoSMAD3 (pSMAD3)/SMAD3 and band intensity (densitometry), and data are mean ± standard deviation (WSC: n = 4; CC: n = 3). (C) Relative levels of MAPK signalling components (WSC: n = 7–10; CC: n = 8–10; MFI value). (D) Relative levels of transcription factors related to MAPK signalling (WSC: n = 7–10; CC: n = 8–10; MFI value).
