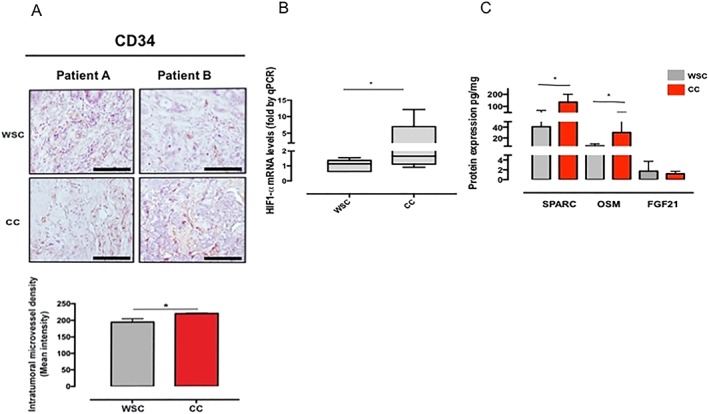
Figure 5.

Angiogenesis mediated by hypoxia in the tumour of cachectic patients. Data were expressed as mean ± standard deviation or as median [first quartile; third quartile]. *Significant difference between the groups was tested using unpaired t‐test and Mann–Whitney U test (P < 0.05). Protein concentration expressed to medium fluorescent intensity (MFI). (A) Immunohistochemical staining for intratumoural microvessel density [CD34+; weight‐stable cancer (WSC): n = 4 and cancer cachexia (CC): n = 4]. (B) Gene expression of hypoxia‐inducible factor‐1α (HIF1‐α) (WSC: n = 7 and CC: n = 7). (C) Protein expression of myokines in tumour micro‐environment of cachectic patients (n = 7–8). FGF21, fibroblast growth factor 21; OSM, oncostatin M; qRT‐PCR, Real‐Time Quantitative Reverse Transcription PCR; SPARC, secreted protein acidic and rich in cysteine. Scale bar: 110.0 μm.
