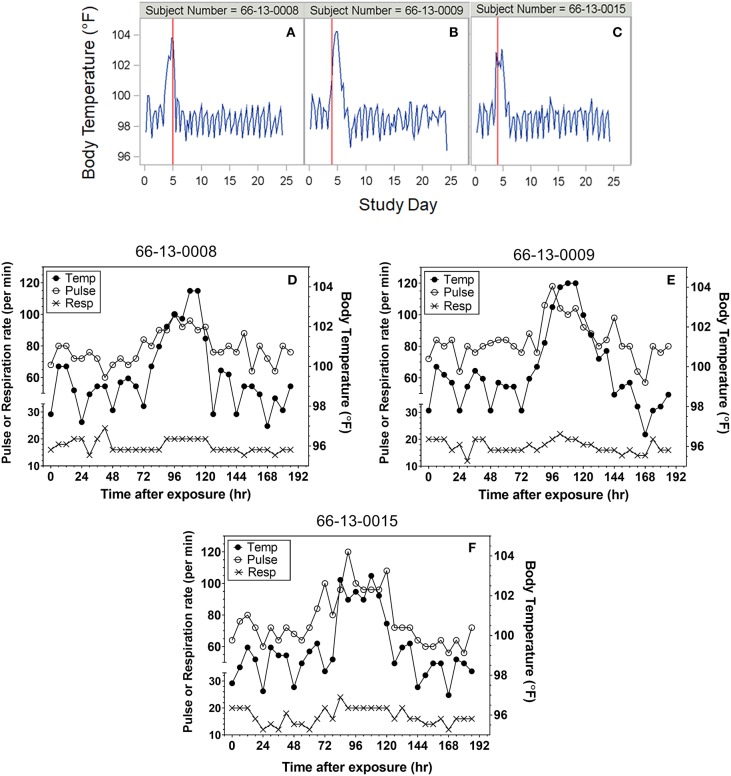
Figure 1.
Representative plots of vital signs for subjects exposed to 25,000 cfu. (A–C) Representative temperature plots derived from body temperature (in °F) listings over the entire course of the study. The red vertical line represents the study day (@ 000 h) where antibiotic was administered. (D–F) Overlay plots for the same subjects in which body temperature changes (closed circles, in °F) are plotted with pulse rate (open circles) and respiration rate (X) over the first eight study days after exposure.

