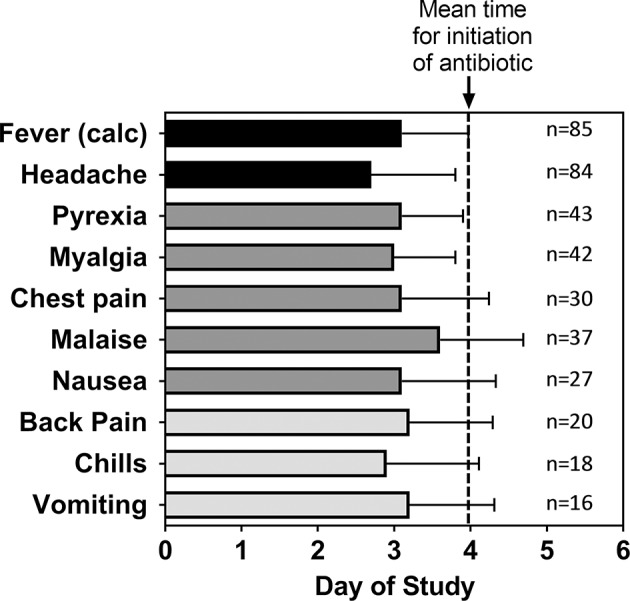
Figure 3.

Mean time for adverse events after inhalational exposure to F. tularensis Schu S4. For the indicated number (n) of subjects that reported the given Adverse Event, the mean study day (± SD) when each of the adverse events were first reported was calculated. The data are compared to the calculated time of fever onset [Fever (calc)] as shown in Table 2 and the mean study day when antibiotic treatment was initiated (dashed line). The data represent only subjects exposed to a target exposure of 25,000 cfu.
