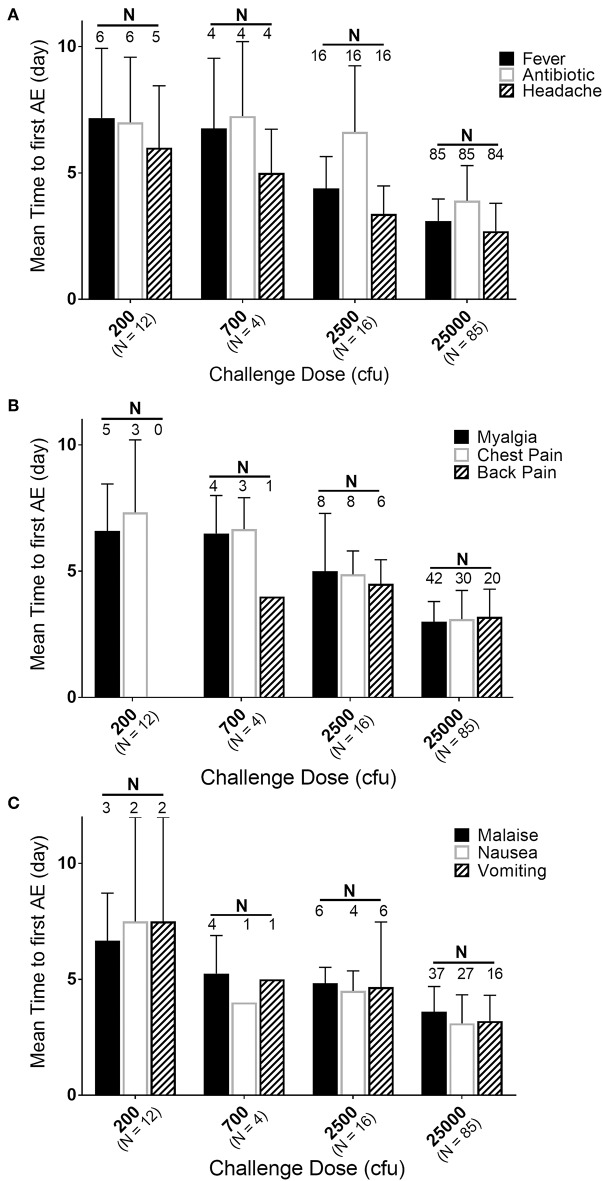
Figure 4.
Relationship of mean time to adverse event onset to exposure dose. Mean day (± SD) of first reporting of Adverse Events upon challenge with indicated doses of F. tularensis Schu S4. (A) Represents those in the majority or all of subjects, (B) represents AEs present in about half of subjects and (C) those in about 30% of subjects. Number of subjects exposed are indicated with dose, while the number of subjects that had a particular AE are labeled above the respective bars. Fever is calculated in hours and back-calculated to days, while other AEs and antibiotic administration are only reported by day of study. Note that only 50% of subjects exposed to 200 cfu experienced fever. Any of those exposed to 200 cfu that did not get fever, also did not get treated with antibiotic and only one developed antibodies by agglutination microtiter.

