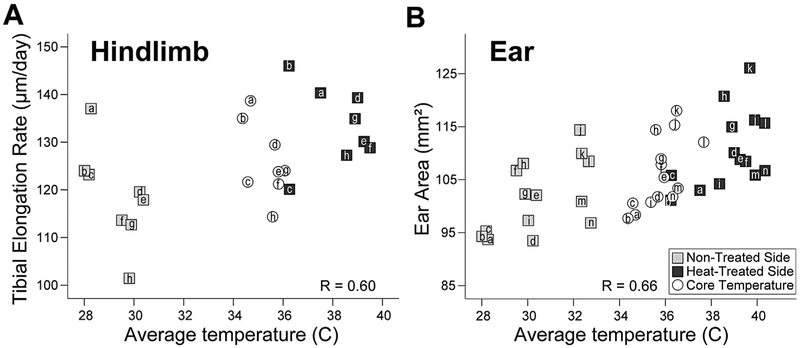
Figure 2.
Extremity temperature correlates with extremity growth. Scatter plots of average temperatures of the hindlimb (A) and ear (B) taken during treatments show a significant positive relationship with growth of non-treated (gray squares) and heat-treated (black squares) sides. Individual 5-week-old mice are denoted by unique letters, which correspond to the same mouse in both graphs. Legend is in (B). For reference, core temperature during treatment (open circles) is plotted against the average value of heat-treated and non-treated sides for each variable. Core was not included in correlation statistics. See text for details.

