Figure 3.
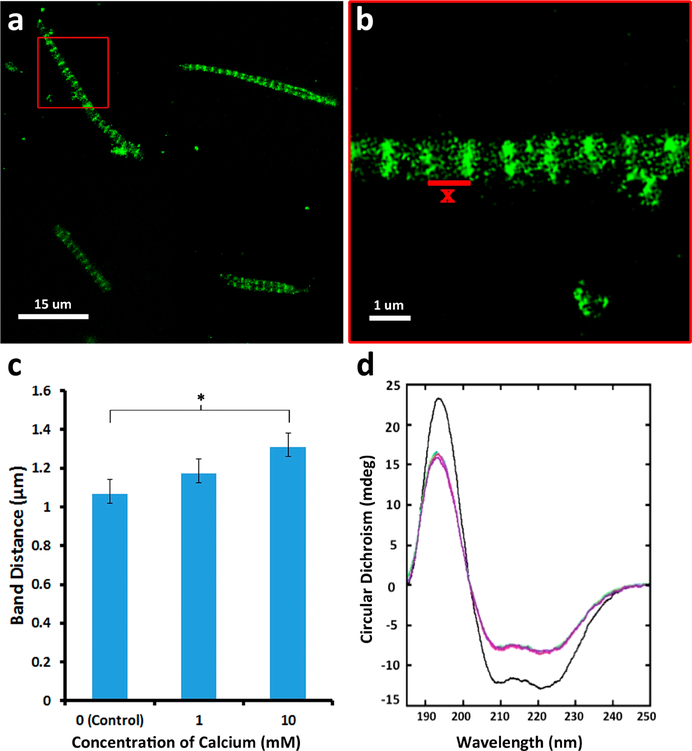
Myosin undergoes structural changes in the presence of elevated calcium. (a, b) Mouse muscle fibers exposed to calcium results in approximately a 10% increase in the distance between the A bands (data presented are MEAN ± SEM, n = 5). (c) Dose-dependent increase in A band distances (*p < 0.005). (d) Circular dichroism spectroscopy of BC myosin demonstrates unwinding of the α helix (Supporting Information, Table 1S). Calcium concentrations used are 0 mM (black), 5 mM (blue), 10 mM (green), and 15 mM (red). An average of 30 scans were collected in total for each sample from triplicate preparations.

