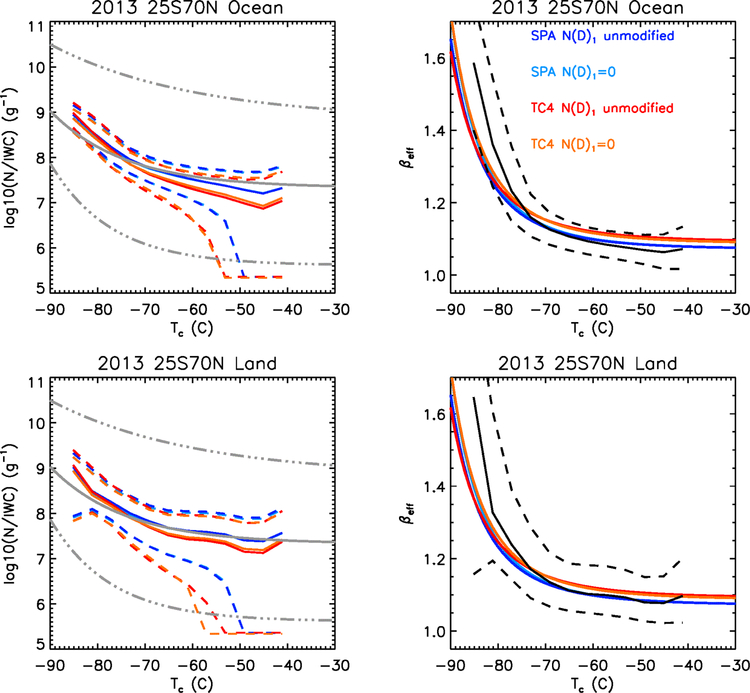
Fig. 9.
Left: Comparisons of the median CALIPSO IIR N/IWC (g−1) for the four formulations with in situ measurements from Krämer et al. (2009) shown by the grey curves; top and bottom being minimum and maximum values and middle grey solid curve being the middle value. Solid curves are median values while dashed curves indicate the 25th and 75th percentile values. Right: Comparisons of CALIPSO IIR βeff shown by the black curves (solid curve are median values while dashed curves indicate the 25th and 75th percentile values) with the four in situ βeff inferred from in situ N/IWC (from Krämer et al. (2009) using the four formulations. The navy and light blue curves correspond to the SPARTICUS formulations for the unmodified N(D)1 assumption and the N(D)1 = 0 assumption, respectively. The red and orange curves are using the TC4 formulations for the N(D)1 unmodified and N(D)1 = 0 assumptions, respectively. The CALIPSO IIR retrievals are for the approximate latitude range (25 °S to 70 °N) of the in situ data, over oceans (top) and over land (bottom).

