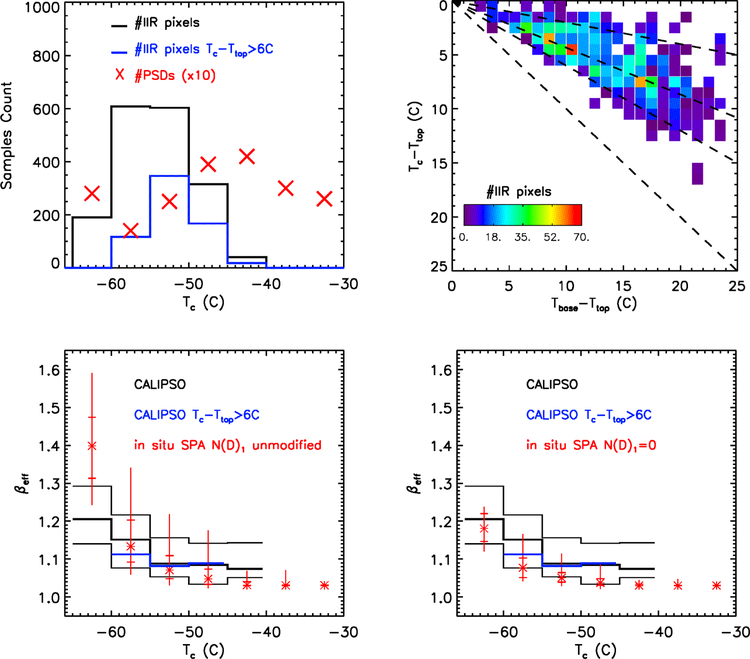
Figure 8a:
Statistical comparison of CALIPSO IIR βeff and and in situ βeff (synoptic cirrus) during SPARTICUS (sampled January-April 2010). Top left: The red X symbols indicate the number of PSDs used in the SPARTICUS analysis (multiplied by 10 for clarity of presentation) within 5°C in situ temperature intervals, while the black histogram indicates the number of CALIPSO IIR pixels in each Tc temperature interval, and the blue histogram indicates the number of IIR pixels where Tc - Ttop is larger than 6°C. Top right: 2D-histograms of Tc - Ttop and Tbase - Ttop for the IIR pixels. The dashed lines from top to bottom are 20%, 43% (average value) and 60% from cloud top, with Tc = Tbase for the lowest curve. Bottom: Temperature dependence of in situ βeff derived assuming N(D)1 unmodified (left) and N(D)1=0 (right). The vertical lines give the measurement range, the horizontal bars give the 25th and 75th percentile values, and the asterisks give the median value. CALIPSO IIR median βeff is given by the thick black histogram, with thin black histograms giving the 25th and 75th percentile values. The thick blue histogram is CALIPSO IIR median βeff where Tc - Ttop > 6°C.

