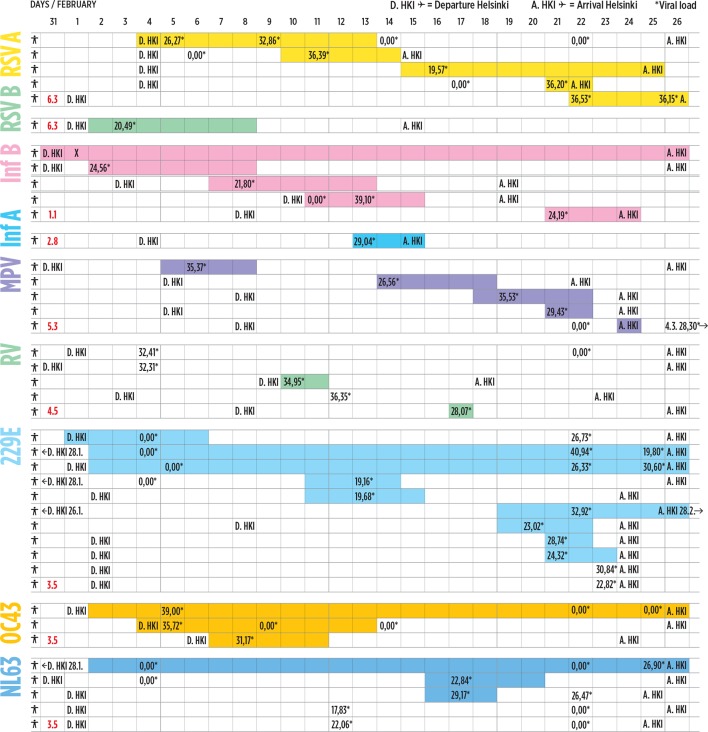
Figure 2.
Occurrence and aetiology of the common cold. The figure shows the departure day (D) from Helsinki and the arrival day (A) to Helsinki of each subject who got the common cold during the Games. The coloured bars represent different viruses and the length of the bar the duration of respiratory symptoms in days. The red numbers show the incubation periods the viruses.34 *The numbers in the coloured bars give Ct-values which reflect inversely viral load, <27 reflects high viral load. Number 0 means virus negative test; X means diagnosed by the antigen detection by the local healthcare.  RSV A, respiratory syncytial virus A;
  RSV B, respiratory syncytial virus B;
  Inf B, influenza B virus;
  Inf A, influenza A virus;
  MPV, human metapneumovirus;
  RV, rhinovirus;
  229E, human coronavirus 229E;
  OC43, human coronavirus OC43;
  NL63, human coronavirus NL63.

