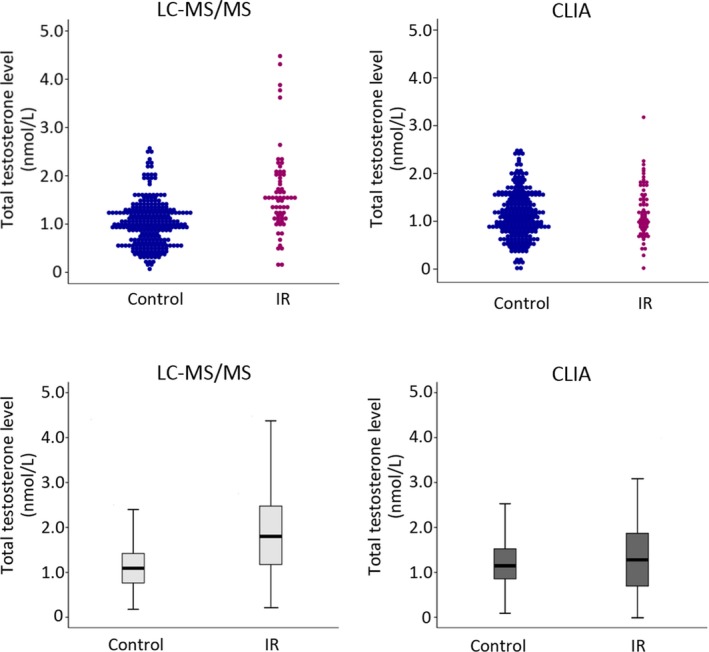
Figure 1.

Comparison of the distribution of TT assessed by LC‐MS/MS and CLIA measurements in IR and control groups. TT measured by LC‐MS/MS: IR group vs control group (means ± SD) = 1.65 ± 0.88 nmol/L vs 1.02 ± 0.46 nmol/L (P < 0.001). TT measured by CLIA: IR group vs control group (means ± SD) = 1.22 ± 0.56 nmol/L vs 1.12 ± 0.49 nmol/L (P = 0.239). The line in the middle of the box represents the median TT level; the lower boundary of the box indicates the 25th percentile, and the upper boundary indicates the 75th percentile. CLIA, chemiluminescent immunoassay; IR, insulin resistance; LC‐MS/MS, liquid chromatography and tandem mass spectrometry assay; TT, total testosterone
