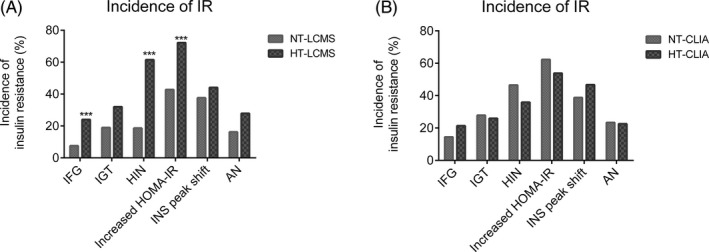
Figure 3.

Comparison of the incidence of IR identified by different parameters among PCOS patients with or without HA assessed by LC‐MS/MS or CLIA#. AN, acanthosis nigricans; HIN, hyperinsulinemia; HOMA‐IR, fasting glucose (mmol/L) × fasting insulin (mIU/L)/22.5, homeostatic model assessment of IR; HT‐CLIA, the subgroup with TT ≥2.39 nmol/L determined by CLIA; HT‐LCMS, the subgroup with TT ≥1.85 nmol/L determined by LC‐MS/MS; IFG, impaired fasting glucose; IGT, impaired glucose tolerance; NT‐CLIA, the subgroup with normal TT (<2.39 nmol/L) determined by CLIA; NT‐LCMS, the subgroup with normal TT (<1.85 nmol/L) determined by LC‐MS/MS. ***P < 0.001. #The numbers of subjects were 332 for the analysis of IFG, HIN, and HOMA‐IR, 210 for IGT, 204 for INS peak shift and 178 for AN
