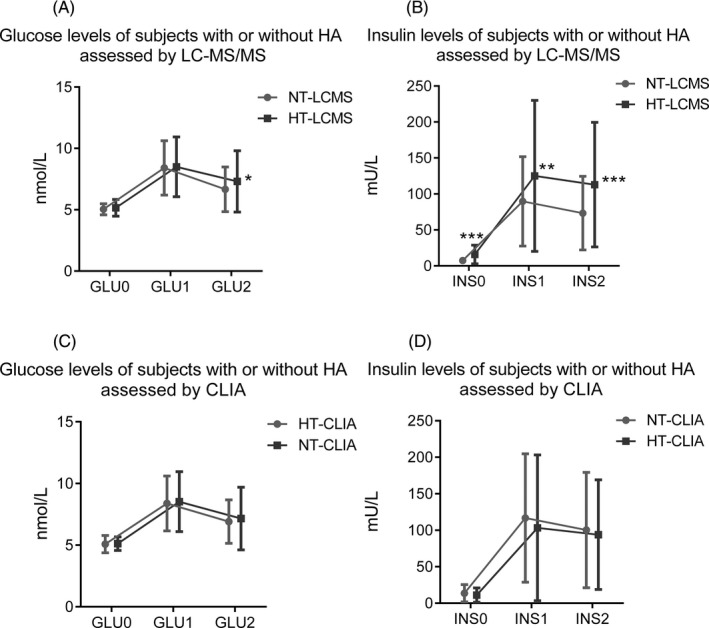
Figure 4.

Glucose and insulin levels of PCOS women with or without HA (different phenotypes of PCOS) during a 2‐h OGTT. A, Glucose levels of the PCOS women with or without HT assessed by LC‐MS/MS (n = 210); B, Insulin levels of the PCOS women with or without HT assessed by LC‐MS/MS (n = 201); C, Glucose levels of the PCOS women with or without HT assessed by CLIA (n = 210); D, Insulin levels of the PCOS women with or without HT assessed by CLIA (n = 201). GLU0, fasting plasma glucose; GLU1, plasma glucose level at 1 h after glucose administration; GLU2, plasma glucose level at 2 h after glucose administration; INS0, fasting plasma insulin; INS1, plasma insulin level at 1 h after glucose administration; INS2, plasma insulin level at 2 h after glucose administration. *P < 0.05; ***P < 0.001
