
Figure 2.
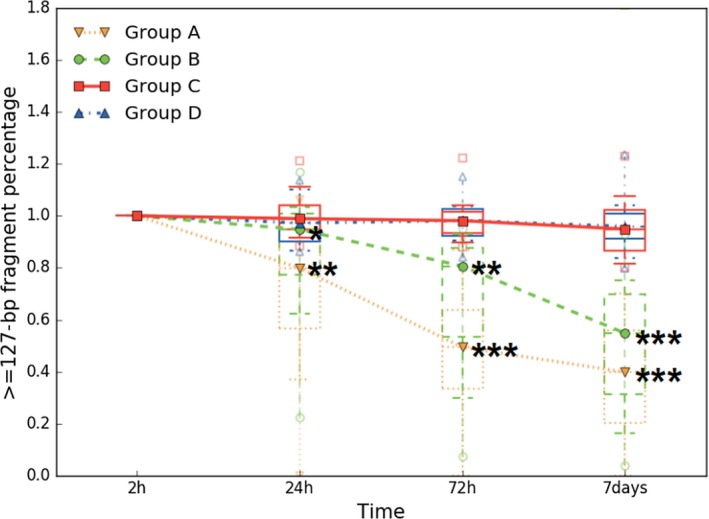
Preservative effect of ucfDNA through UCTs. Urine samples were collected from 15 patients and placed at ambient temperature. Groups A and B were, respectively, expressed samples without urinary cells and with urinary cells by using normal tubes, and groups C and D were, respectively, expressed samples without urinary cells and with urinary cells by using UCTs. In each box plot, the line inside of the box indicates the median value; the limits of the box indicate the 75th and 25th percentiles. The upper and lower error bars, respectively, represent the 5th and 95th percentiles. The uppermost and lowermost plots represent the maximum and minimum values. Over time, statistically significant ucfDNA changes were not observed in groups C and D. Statistically significant ucfDNA time‐dependent degradation was only observed in groups A and B (*P < 0.05, **P < 0.01, ***P ≤ 0.001 by paired Student's t test)