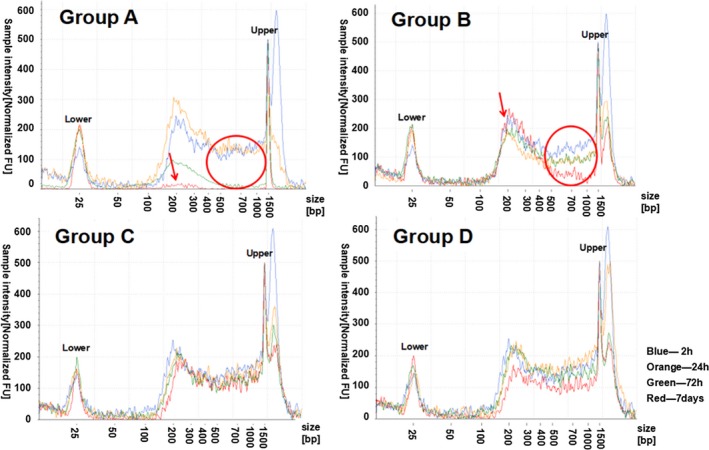
Figure 4.

Electropherograms of ucfDNA samples No. 9. Groups A and B were, respectively, expressed samples without urinary cells and with urinary cells by using normal tubes, and groups C and D were, respectively, expressed samples without urinary cells and with urinary cells by using UCTs. The x‐axis represents the different sizes of the marker; the valid region was between the lower and upper sizes. The y‐axis represents the normalized sample intensity; the regions with high intensity demonstrate a high concentration
