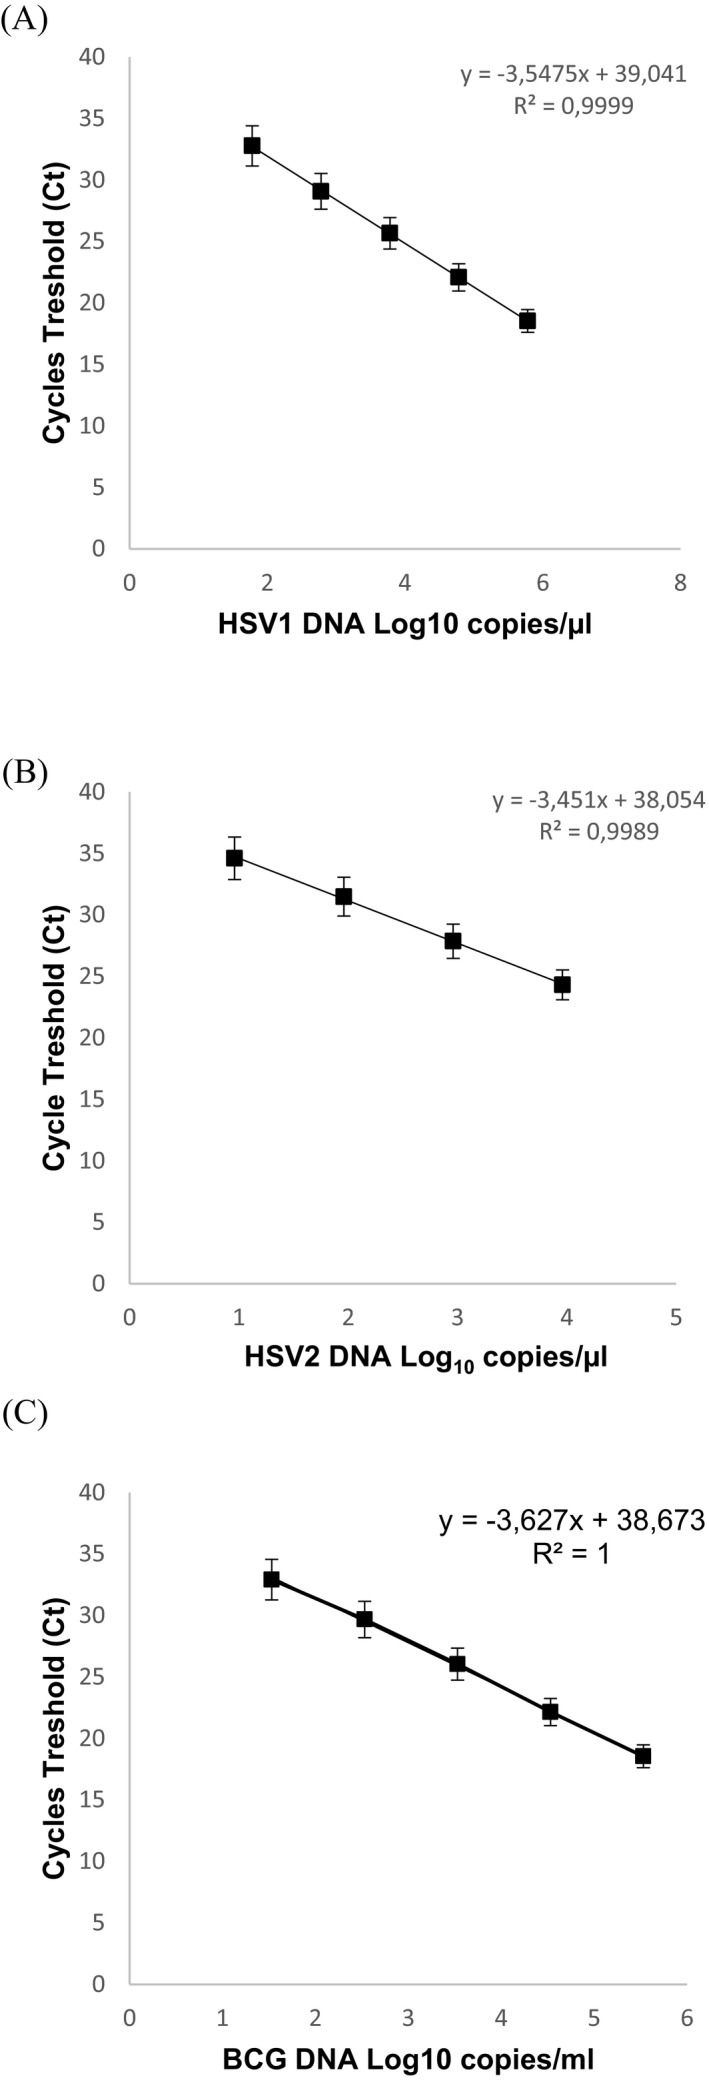
Figure 2.

Duplex HSV1/HSV2 and Mycobacterium tuberculosis PCR standard curves established by means of serial dilutions of DNA. The HSV1 standard curve is represented by (A), the HSV2 standard curve by (B), and the BCG DNA standard curve by (C). BCG, bacillus Calmette‐Guerin; HSV, herpes simplex virus
