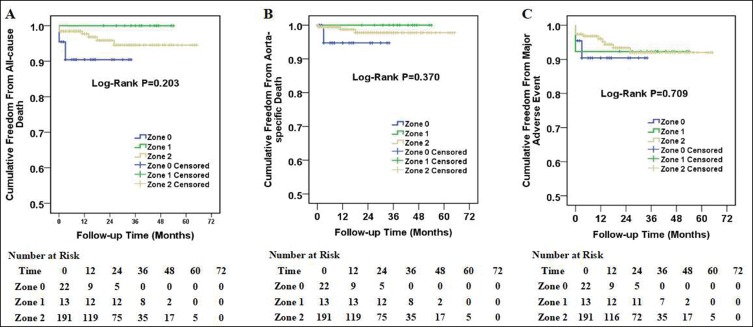
Figure 2.
Kaplan–Meier curves among patients with zone 0, zone 1 and zone 2 aortic arch diseases. Cumulative all-cause death curves (A), aorta-specific death curves (B) and major adverse event curves (C) in patients with zone 0, zone 1 and zone 2 aortic arch diseases. The number of patients at risk at each year was listed in the bottom of the figure.

