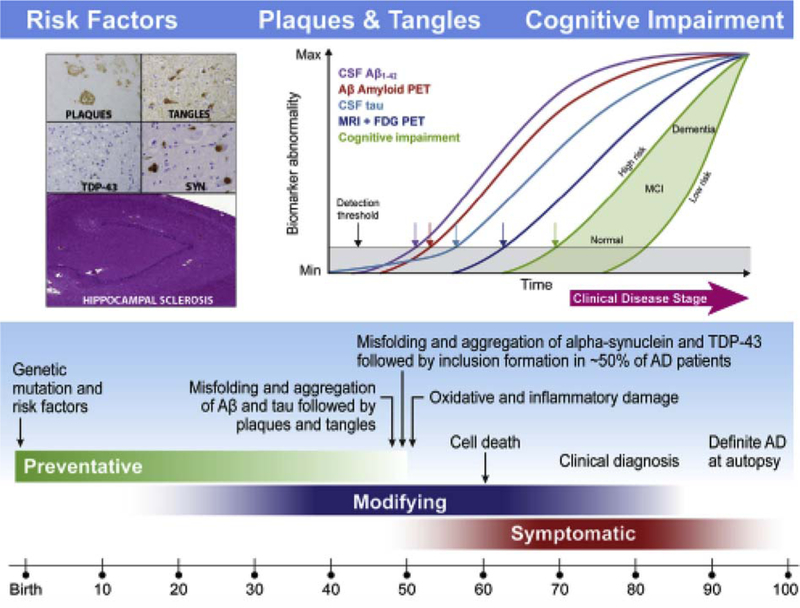
Fig. 15.
Schematic outlining of the current understanding of the hypothetical timeline for the onset and progression of AD neurodegeneration and cognitive impairments. Age is indicated at the bottom, whereas the green, blue, and red bars indicate the time at which preventive, disease-modifying, and symptomatic interventions, respectively, are likely to be most effective. Within the aqua bar, milestones are shown in the pathobiology of AD that culminate in death and autopsy confirmation of AD. The proposed ADNI model of the temporal ordering of biomarkers of AD pathology relative to stages in the clinical onset and progression of AD is shown in the insert at the upper right based on Jack et al. [258], whereas the insert at the left illustrates the defining plaque and tangle pathologies of AD and common comorbid pathologies including Lewy body pathology (SYN), TDP-43, and hippocampal sclerosis. In the insert on the right, clinical disease is on the horizontal axis and it is divided into three stages: CN, MCI, and dementia. The vertical axis indicates the range from normal to abnormal for each of the biomarkers and the measures of memory and functional impairments. Abbreviations: AD, Alzheimer’s disease; ADNI, Alzheimer’s Disease Neuroimaging Initiative; CN, cognitively normal; CSF, cerebrospinal fluid; FDG, [18F]-fluorodeoxyglucose; MCI, mild cognitive impairment; MRI, magnetic resonance imaging; PET, positron emission tomography. Reproduced with permission from [129].

