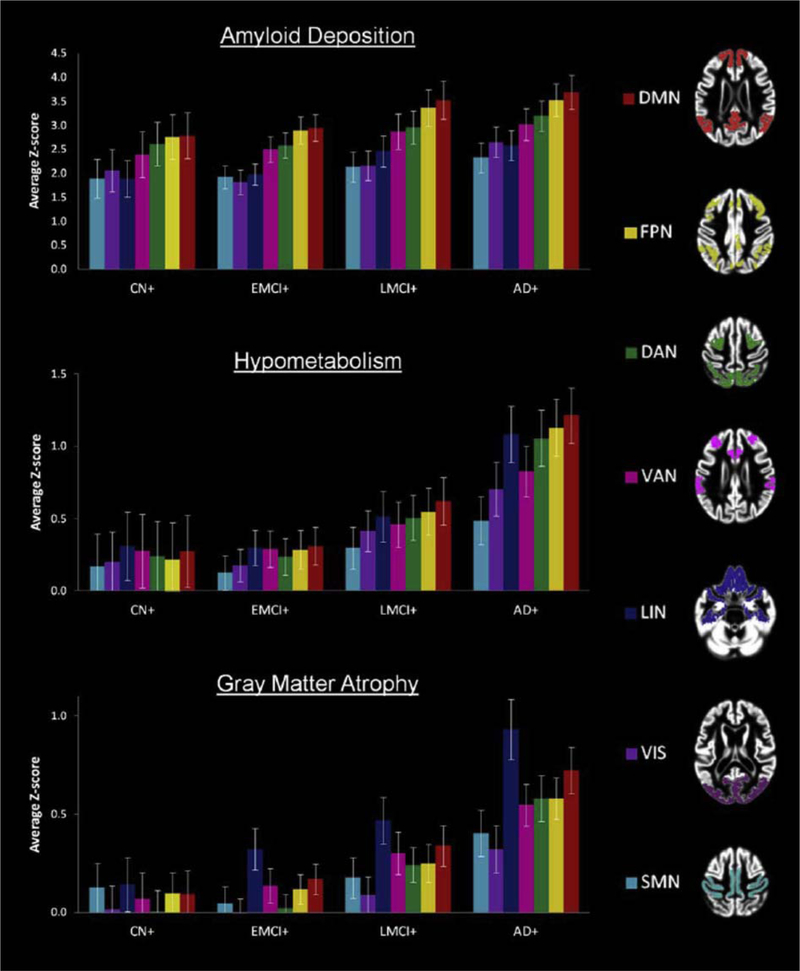
Fig. 33.
Severity of AD-related imaging abnormalities within intrinsic connectivity networks. Plots depict means and 95% confidence intervals of averaged Z scores of Aβ deposition (top), hypometabolism (middle), and gray-matter atrophy (bottom) within the distinct intrinsic connectivity networks for each AD stage. The widespread distribution of amyloid deposition across the cerebral cortex appeared similar in all patient groups with highest amyloid load in the DMN and FPN. Hypometabolism was most pronounced in the AD group and occurred across most ICNs except the VIS and SMN. Likewise, atrophy was most pronounced in the AD group, which displayed a different relative pattern of atrophy severity across ICNs with atrophy most pronounced in the LIN followed by the DMN and relative sparing of the FPN. Abbreviations: blue, limbic network (LIN); cyan, somatomotor network (SMN); green, dorsal attention network (DAN); pink, ventral attention network (VAN); purple, visual network (VIS); red, default mode network (DMN); yellow, frontal parietal control network (FTN); AD, Alzheimer’s disease; CN, cognitively normal; EMCI, early mild cognitive impairment; LMCI, late mild cognitive impairment. Reproduced with permission from [335].

