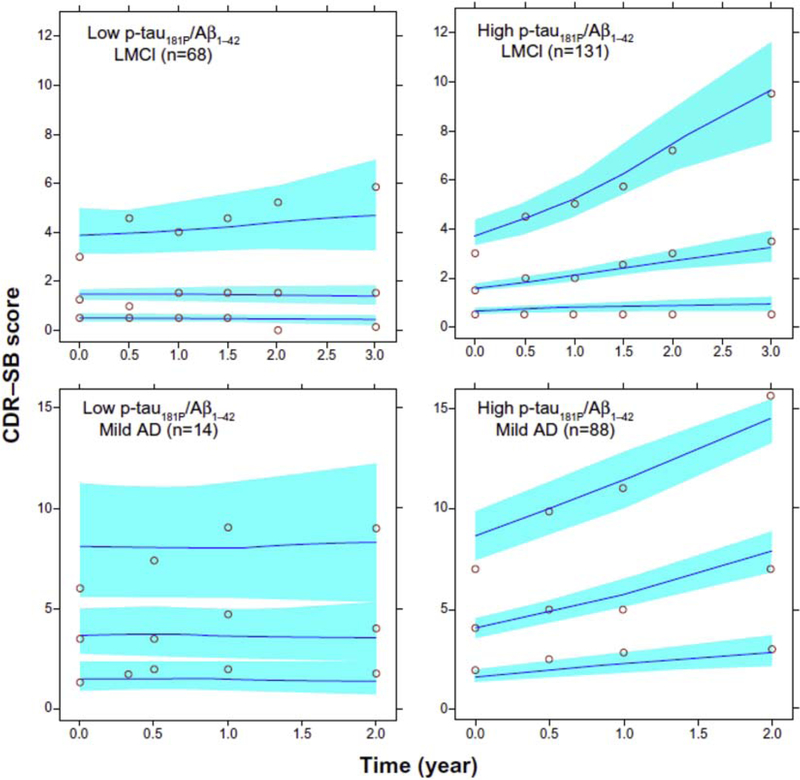
Fig. 41.
Nonlinear disease progression model capturing longitudinal Clinical Dementia Rating–Sum of Boxes (CDR-SB) scores. Visual predictive check simulations suggest that the model describes longitudinal progression of CDR-SB scores in both late MCI and mild AD subjects. Stratification using p-tau181/Aβ42 ratio reveals a lack of disease progression in biomarker negative subgroups. The upper, middle, and lower profiles indicated by the open circles represent the 95th, 50th, and 5th percentiles of the observed data, respectively. The upper, middle, and lower curves indicated by the lines are the median model–based predictions for the 95th, 50th, and 5th percentiles, respectively. The shaded areas are the 90% confidence intervals of the corresponding percentiles of the simulations based on the model. Abbreviations: AD, Alzheimer’s disease; LMCI, late MCI; MCI, mild cognitive impairment. Reproduced with permission from [459].

