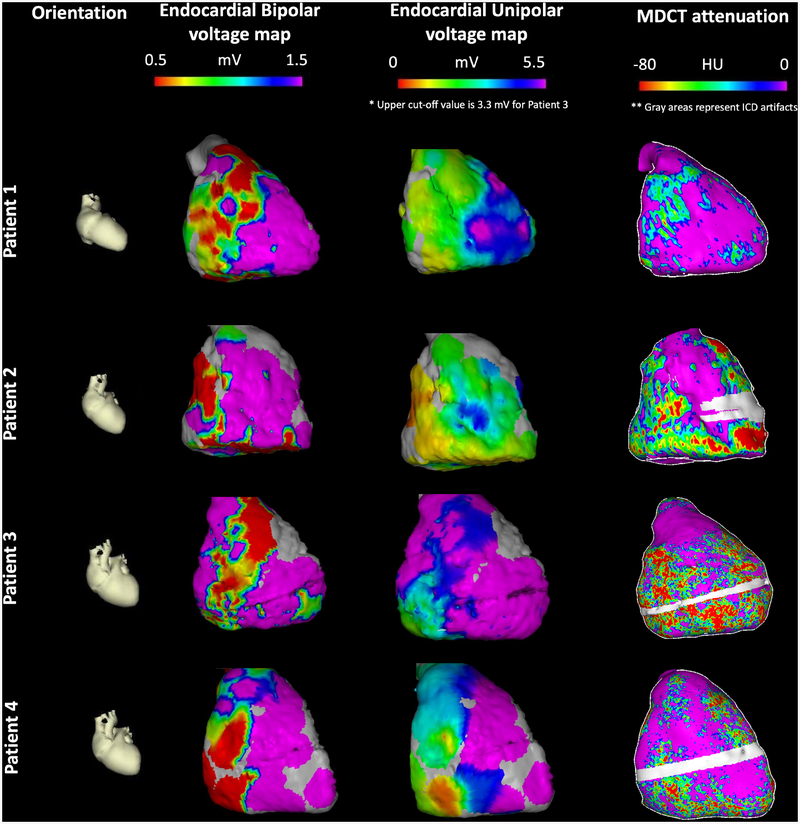
Figure 2. Endocardial bipolar and unipolar voltage vs. attenuation map examples.
Each row represents a different patient. The first column shows cardiac orientation for the subsequent images in each row. The second column images display endocardial bipolar voltage maps projected onto the 3D MDCT shell. The third column images display endocardial unipolar voltage maps projected onto the 3D MDCT shell. Patient 3 had mapping using multi-electrode catheter hence upper cut-off of 3.3 mV was used for visualization. The fourth column images represent RV myocardial MDCT attenuation maps. The gray area in patients 2, 3 and 4 has been excluded due to ICD artifact.

