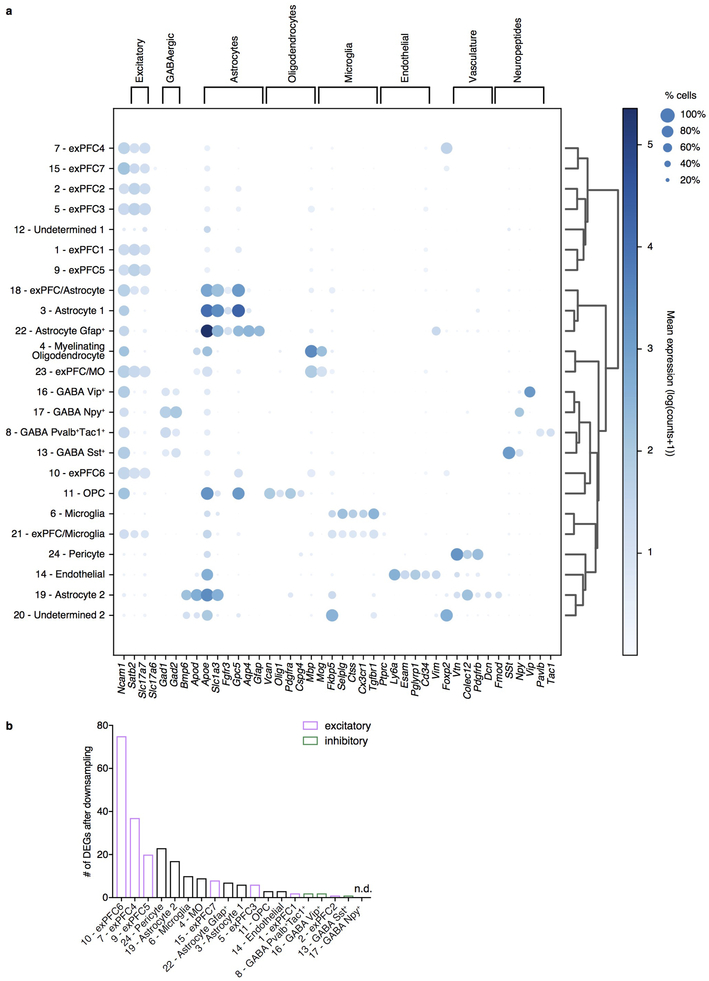
Extended Data Figure 5. Gene expression patterns of individual cell subsets in mPFC.
a, Proportion of expressing cells (dot size) and mean normalized expression of representative marker genes (columns) associated with the cell clusters of Fig. 2a (rows). Clusters are labeled with post facto annotation based on known marker genes. Ambiguous clusters expressing multiple canonical markers across cell types are annotated with both, e.g. exPFC/Astrocyte, and is likely due to doublets. b, Number of significantly differentially expressed genes (z-test calculated on coefficients of mixed linear model, Bonferroni-corrected P<10−7) by cluster after downsampling, ranked by highest to lowest (clusters of doublets and undetermined annotations not included). exPFC = glutamatergic excitatory neurons from the PFC, GABA = GABAergic interneurons, OPC = oligodendrocyte progenitor cells, MO = myelinating oligodendrocyte.

