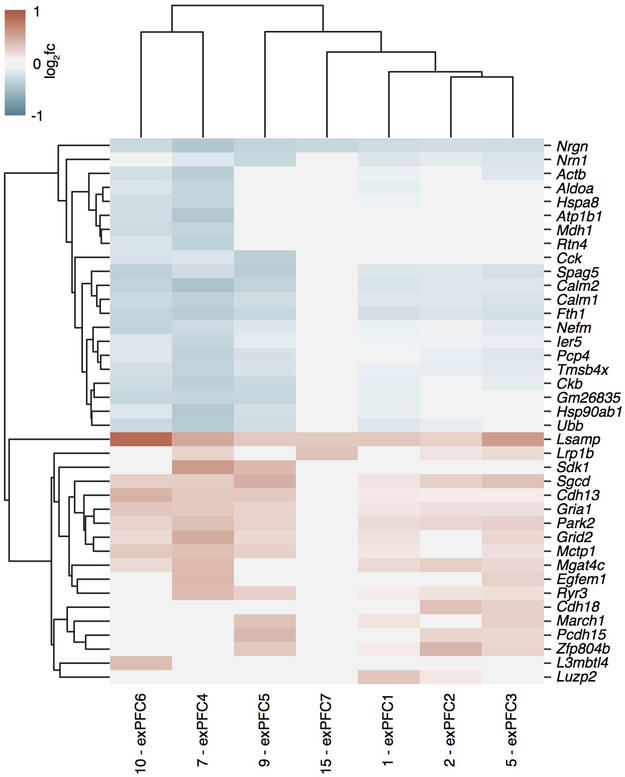
Extended Data Figure 7. Differentially expressed genes of ABX vs. Control mPFC samples shared by all excitatory neuronal subsets.
Mean fold change in expression in excitatory neurons (columns) in Fig. 2a of genes (rows) that were significantly differentially expressed (z-test calculated on coefficients of mixed linear model, Bonferroni-corrected P<10−7) in at least 2 of these clusters, and with absolute(log2fc) >= 0.31 in at least one cluster.

