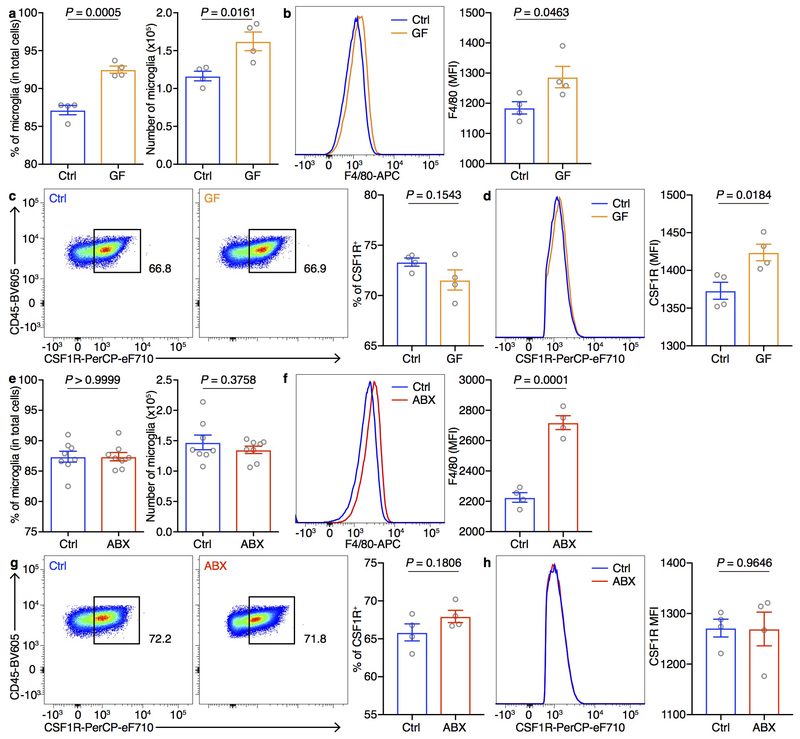
Extended Data Figure 9. Microglia in GF and ABX mice exhibit a developmentally immature phenotype.
a, Population frequencies and numbers of microglia in Ctrl and GF mice. b, Representative flow cytometry histogram and mean fluorescence intensity (MFI) of F4/80 staining on microglia from Ctrl and GF mice. c, Representative flow cytometry plots and population frequencies of CSF1R+ microglia in Ctrl and GF mice. d, Representative flow cytometry histogram and MFI of CSF1R expression gated on CSF1R+ microglia from Ctrl and GF mice. Data in a-d are representative of three independent experiments. n = 4/group. e, Population frequencies and numbers of microglia in Ctrl and ABX mice. f, Representative flow cytometry histogram and MFI of F4/80 staining on microglia from Ctrl and ABX mice. g, Representative flow cytometry plots and population frequencies of CSF1R+ microglia in Ctrl and ABX mice. h, Representative flow cytometry histogram and MFI of CSF1R expression gated on CSF1R+ microglia from Ctrl and ABX mice. Data in e are pooled from two independent experiments. n = 8/group. Data in f-h are representative of two independent experiments. n = 4/group. Data are mean ± SEM. Unpaired two-sided t tests were used. P values are indicated on the figure.

