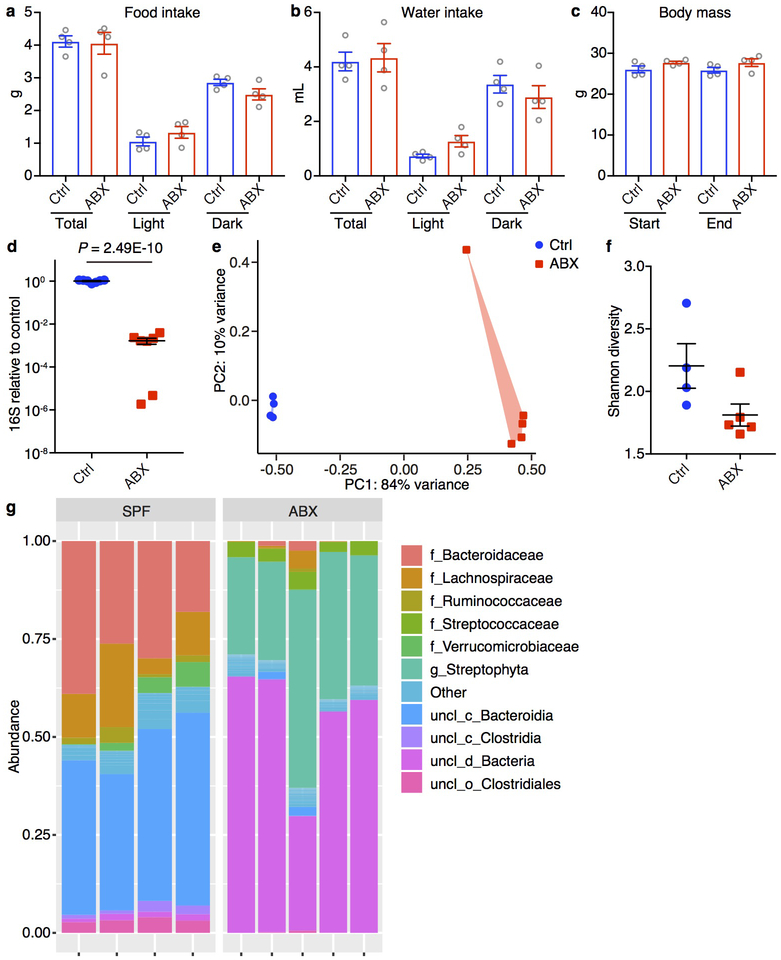
Extended Data Figure 1. Antibiotic treatment results in bacterial community restructuring.
a-c, Food intake (a), water intake (b) and weight gain (c) of the mice measured by the Promethion Metabolic Cage System. Antibiotic treatment was started 2 weeks prior to the experiment and continued for the duration of the experiment. For food (a) and water intake (b), the mice were acclimated to the system for the first 4 days followed by 1 day of data collection. Body mass (c) of the mice were measured at the beginning of (Start) and the end (End) of the 5-day experiment. n = 4/group. Data are mean ± SEM. Total, full day. Light/Dark, 12-hour light/dark cycle. d, 16S rDNA gene copies as quantified by real-time RT-PCR from stool pellets collected from Ctrl or ABX mice. Data are pooled from two independent experiments. n = 7/group. Data are mean ± SEM. Unpaired two-sided t tests were used. e-g, Principal coordinates analysis (PCoA) (e), alpha-diversity Shannon index (f) and taxonomic classification (g) of 16S rDNA in stool pellets collected from Ctrl or ABX mice. Ctrl n = 4, ABX n = 5. For PCoA plot PERMANOVA: F = 33.579, Df = 1, P = 0.00804. For phylogenetic classification ‘f_’, ‘g_’, ‘uncl_c_’, ‘uncl_d_’ and ‘uncl_o_’ stand for ‘family_’, ‘genus_’, ‘unclassified_class_’, ‘unclassified_domain_’ and ‘unclassified_order_’, respectively. ‘uncl_d_Bacteria’ matches exactly to mitochondria or chloroplasts, most likely from the food. Data are mean ± SEM in f.

