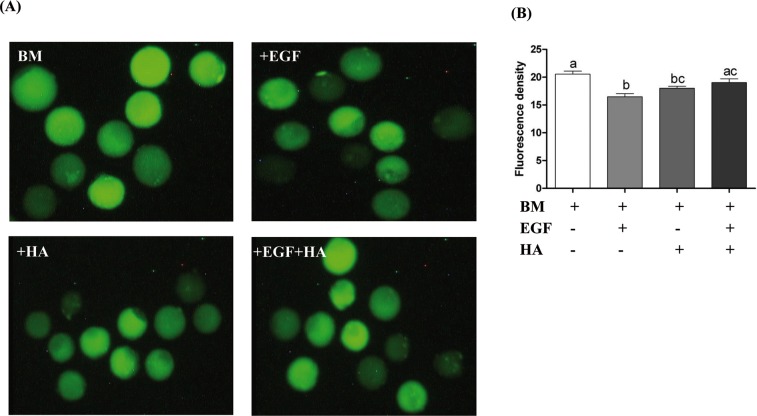
Fig 3. Intracellular ROS accumulation in blastocysts derived from zygotes cultured in media supplemented with EGF and/or HA.
(A) Representative figures displaying the ROS accumulation levels in the blastocysts. (B) The fluorescent density (mean ± SEM) showing the level of ROS in each blastocyst group. Bars with different letters are statistically significant (p < 0.05). Scale bars represent 100 μm.

