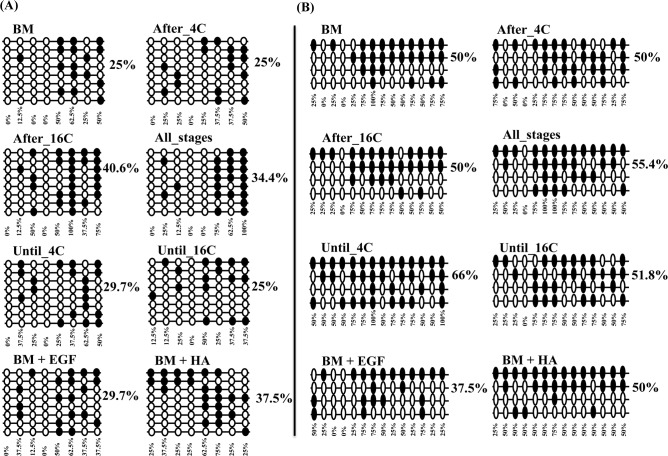
Fig 12.
The DNA methylation pattern of RAC1 gene at promoter (A) or gene body region (B) of blastocysts of different treatment groups. The rows indicate the sequence of different colonies while, the circles indicate the CpG sites within the sequence The black and white circles indicate the methylated and unmethylated CpG sites, respectively.

