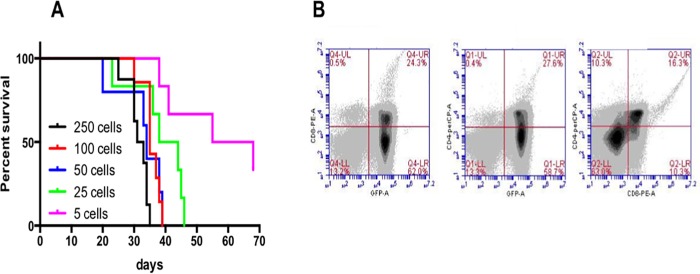
Fig 2. Leukemogenesis was generated by direct injection of splenic ICN-1-induced T-ALL cells.
(A) Kaplan-Meier survival curve of p16+/Luc mice receiving 250, 100, 50, 25, and 5 T-ALL cells. 6 mice were for each dose of injections, including 3 females and 3 males. (B) GFP analysis and CD4+CD8+ surface staining of splenocytes. Numbers in each dot plot refer to the percentages in each quadrant. Cells that express GFP from the Notch1-expressing retrovirus represent T-ALL cells.

