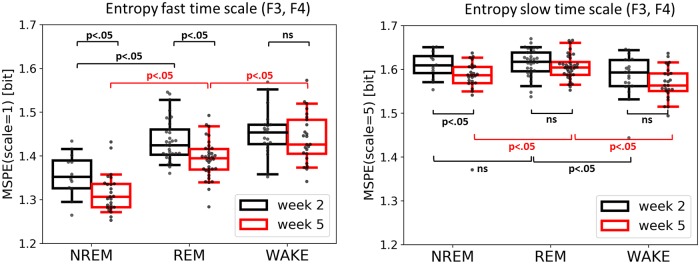
Fig 3. Entropy at both fast (left) and slow (right) time scale across sleep/wake states and the two recording sessions.
MSPE values were averaged over frontal electrodes. Note that at the fast scale all three stages are distinguishable at week 5, but not yet at week 2. At both scales there is a clear difference in signal complexity between week 2 and week 5 with week 2 being generally higher in entropy.

