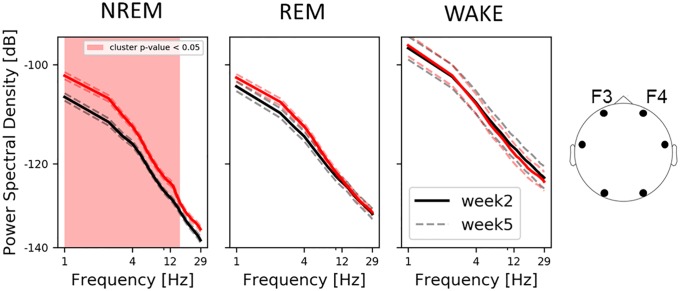
Fig 4. Average log-log-scale PSD spectra per sleep stage over frontal electrodes.
The shaded area highlights statistical differences between week-2 and week-5 recordings. The dashed lines represent the standard error of the mean. Note that only NREM shows differences in the PSD spectra between age groups and the developing 9–14 Hz peak exclusively observed at week-5 of age.

