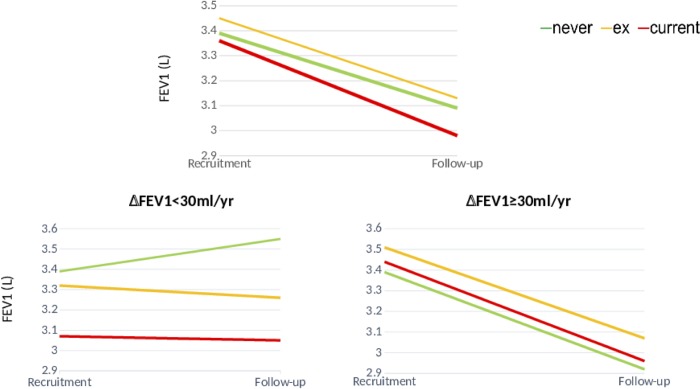
Fig 2.
FEV1 trajectories from baseline to end of follow-up in participants with normal (left) or accelerated decliners in addition to the FEV1 changes (right) stratified by smoking status at the end of follow up (never (green line), former (yellow line) and current smokers (red line). The annualized rates of FEV1 decline within each group were not significantly different. For further explanations, see text.

