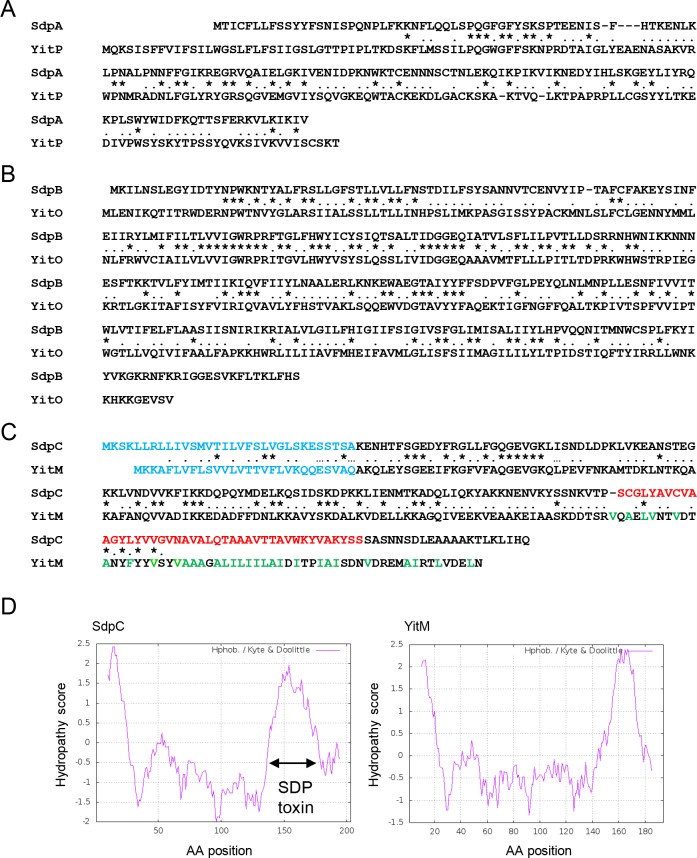
Fig 1. yitPOM is a paralog of sdpABC.
(A) Alignment of SdpA and YitP. (B) Alignment of SdpB and YitO. (C) Alignment of SdpC and YitM. Identical and similar amino acid residues shared by the two proteins are indicated by asterisks and dots, respectively. The signal sequences of SdpC and YitM and the SDP toxin sequence are shown in blue and red, respectively. Hydrophobic amino acid residues in the C-terminal region of YitM are shown in green. (D) Kyte and Doolittle hydropathy plots of SdpC and YitM. The hydropathy score, representing the hydrophobic or hydrophilic properties of amino acid residues was calculated and plotted using the ExPASy website (https://web.expasy.org/protscale/) with a window size of 19.

