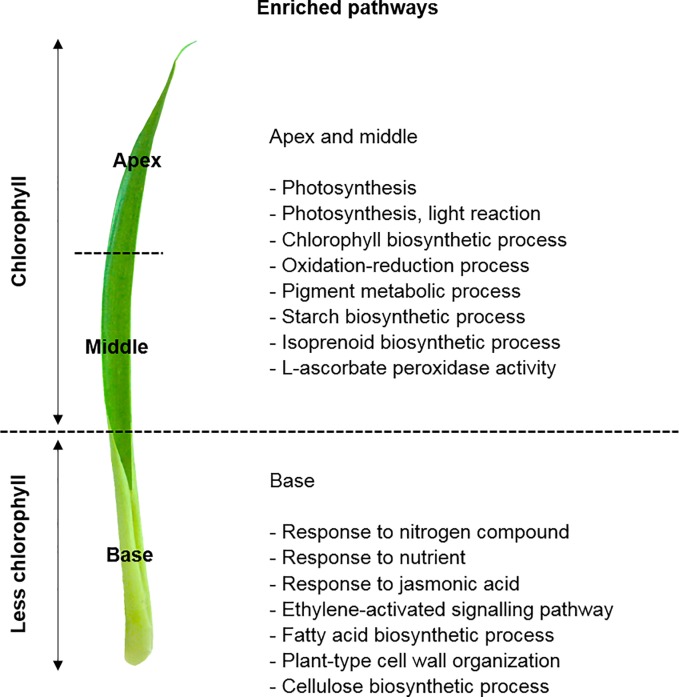
Fig 3. GO and DEGs of the chlorophyll vs. less chlorophyll leaf portions.
Gene Ontology (GO) functional enriched pathways within differentially expressed genes (DEGs) between the chlorophyll leaf portion (apex and middle) compared to the less chlorophyll portion (base) of Guzmania monostachia. This figure was constructed based on the enriched pathways shown in S3 and S4 Tables (Supporting information), and according to the GO terms for biological process, cellular component, or molecular function categories, which showed differential abundance by Fisher’s exact test (FDR < 0.05).

