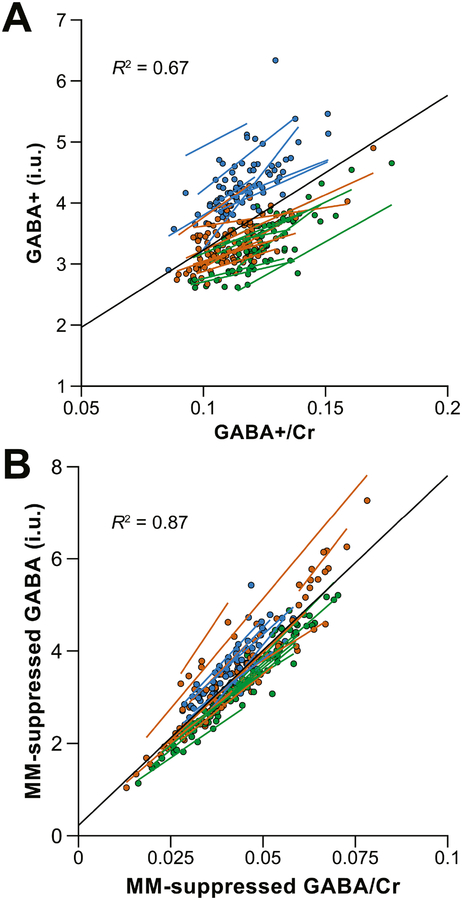
Fig. 5.
Scatterplots illustrating the relationship between (A) water-referenced GABA+ measurements and GABA+/Cr ratios and (B) water-referenced MM-suppressed GABA measurements and MM-suppressed GABA/Cr ratios. Individual measurements are color-coded by vendor (GE in green, Philips in orange, Siemens in blue). The black regression line shows the relationship between GABA+/Cr and water-referenced GABA+ over the entire dataset. Additional color-coded regression lines are shown for each site. R2 values (i.e., the effect sizes) are also displayed.

