
Fig. 1.
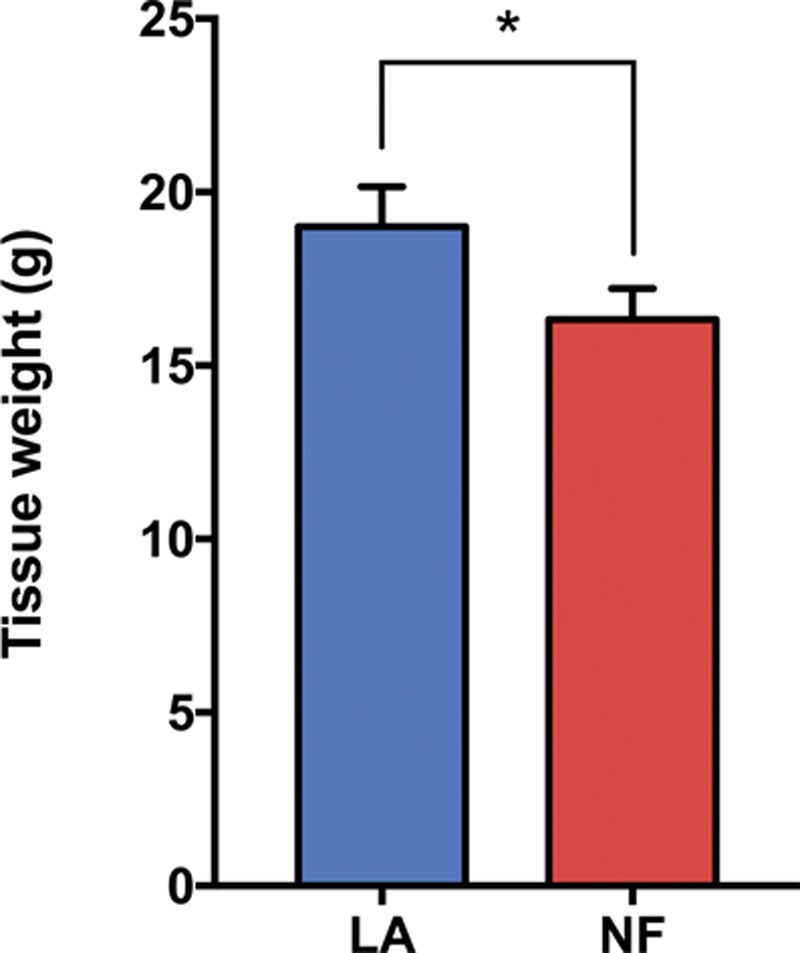
Tissue fraction of nanofat preparations. Bar graphs show tissue weight before (lipoaspirate) and after (nanofat) mechanical processing (n = 3). Values are represented as mean ± SEM and statistical analysis was performed using the paired t test (*p < 0.05). LA, lipoaspirate; NF, nanofat.