
Fig. 2.
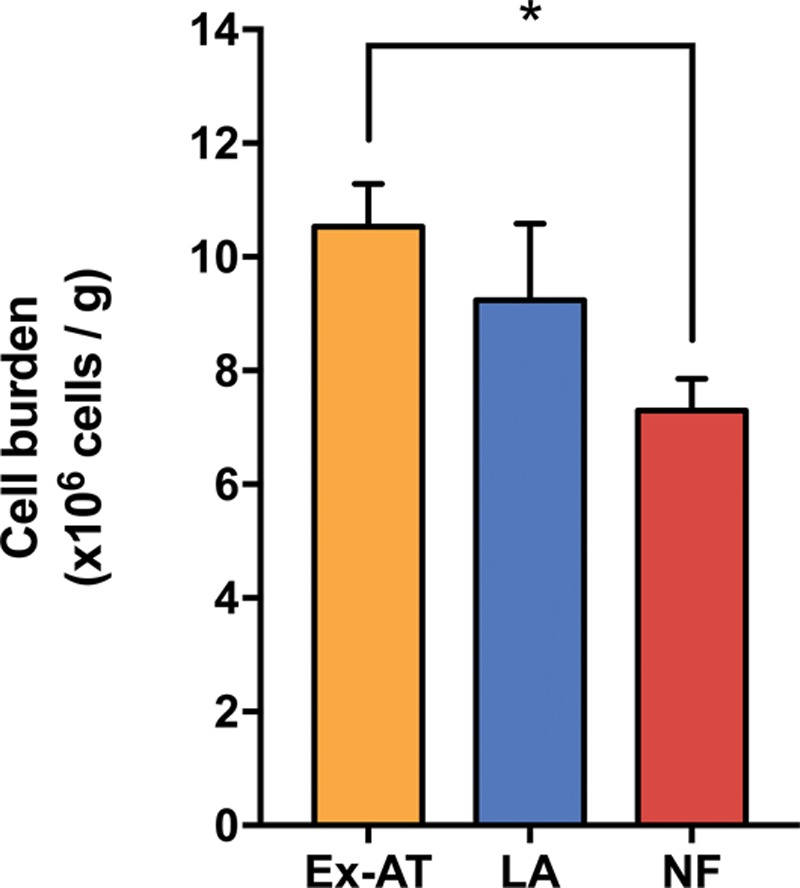
Cell content of excised adipose tissue, lipoaspirate, and nanofat preparations. Bar graphs show the cell burden of different specimens as the number of cells × 106 per gram of sample (n = 5 in excised adipose tissue; n = 4 in lipoaspirate and nanofat). Values are represented as mean ± SEM and statistical analysis was performed using the paired t test between lipoaspirate and nanofat (p = not significant), and unpaired t test between excised adipose tissue and lipoaspirate (p = not significant) and excised adipose tissue and nanofat (*p < 0.05). Ex-AT, excised adipose tissue; LA, lipoaspirate; NF, nanofat.