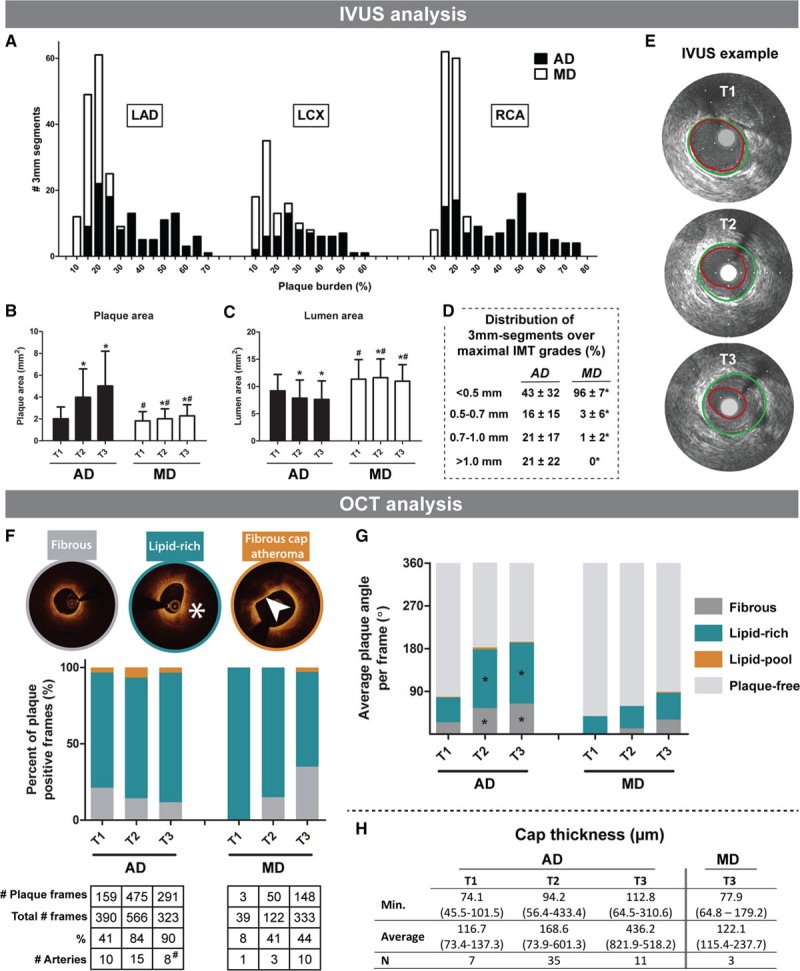
Figure 1.

In vivo intravascular ultrasound (IVUS) and optical coherence tomography (OCT) analysis of coronary plaque development. IVUS analysis (A–E): A, Stacked histogram of the number of 3 mm segments (y axis) with a corresponding PB (%) at the last imaging time point (x axis) of the advanced-diseased pigs (ADs; black bars) and mildly diseased pigs (MDs; white bars) in the left anterior descending coronary artery (LAD), left circumflex coronary artery (LCX), and right coronary artery (RCA). B and C, Change of plaque area (PA; mm2; B) and lumen area (LA; C) between T1 and T3 (mean±SD). *P<0.05 compared with T1. #P<0.05 between MDs and ADs at the corresponding time point. D, Average percentage (±SD) of the number of 3 mm segments per artery that displayed one of the maximal intima-media thickness (IMT) grades at the last imaging time point. *P<0.05 compared with FRs. E, Example IVUS images of plaque growth between T1 and T3 at one location in an AD pig. Vessel wall (green) and lumen border (red) are indicated. OCT analysis (F–H): F, Average percentage of a fibrous, lipid-rich (*) or fibrous cap atheroma (FCA; arrowhead points out lipid-pool with overlying fibrous cap) of all plaque positive frames for T1 to T3. The total number of plaque positive frames and arteries is depicted under the figure. #Note that at T3, data of 2 highly atherosclerotic AD pigs are missing due to early sacrifice after T2. G, The average angle of fibrous plaque, lipid-rich plaque, or lipid-pool per frame at T1 to T3. H, Median (range) cap thickness values derived from the frames presenting with a lipid-pool (ie, FCA). The minimal (Min.) and average thickness, and the number of fibrous caps are displayed.
