Figure 2.

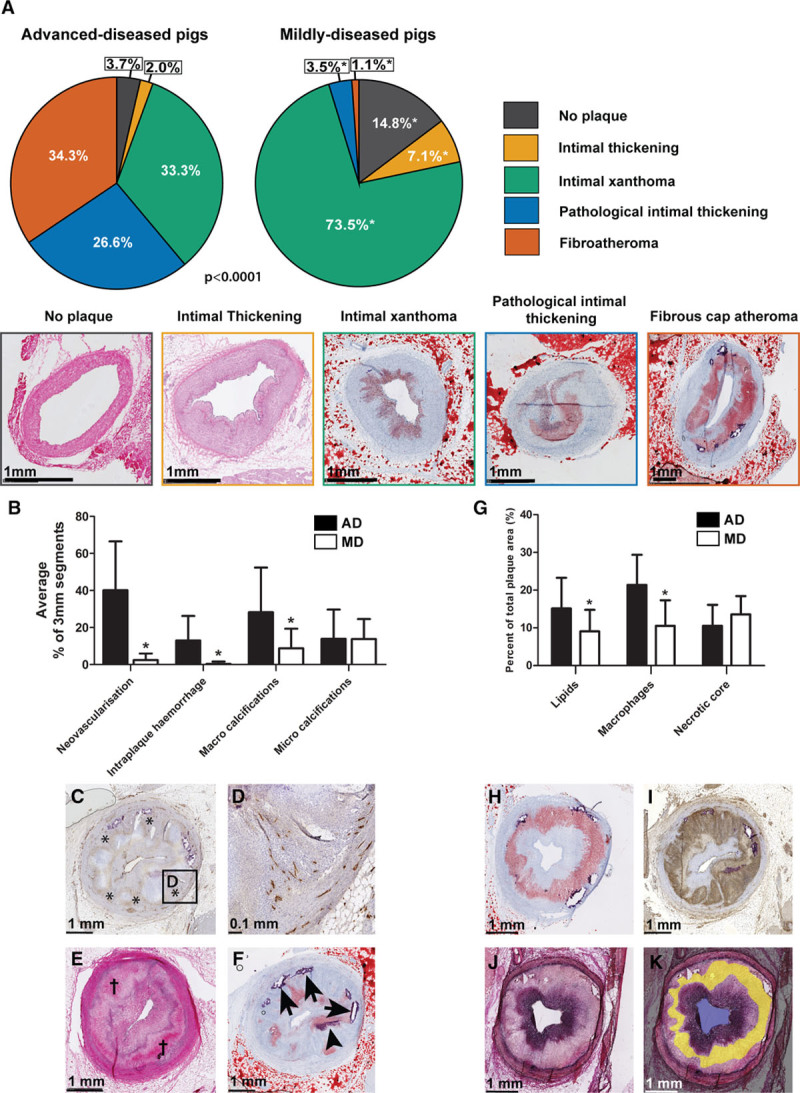
Histological quantification of coronary plaque classification and components. A, Quantification of the frequency of occurrence of the different plaque types. Data are presented as a percentage of the total number of segments, separately for the mildly diseased pigs (MDs; 283 3 mm segments) and advanced-diseased pigs (AD) pigs (297 3 mm-segments). *z-score >1.96 compared with ADs. Bottom of the figure: example images of the respective plaque types: no plaque and intimal thickening: HE-staining; other plaque types: Oil-red-O staining (red=lipids and purple=calcifications). B, Mean (±SD) percentage of 3 mm segments per artery that contained the respective plaque component in ADs (black bars) and MDs (white bars). *P<0.05. C–F, Histological examples of the plaque components quantified in the bar graph. C, Neovascularisation (*, CD31-staining: brown), (D) magnification of (C). E, Intraplaque hemorrhage (†, HE-staining). F, Lipids (Oil-red-O staining: red), microcalcifications (arrowhead), and macrocalcifications (arrows). G, Mean (±SD) area percentage per artery of the respective plaque component in ADs (black bars) and MDs (white bars) in segments positive for that plaque component. *P<0.05 compared with ADs. H–K, Example images of: (H) lipids (Oil-red-O staining; red); (I) macrophages (CD68 staining: brown); (J) collagen (Miller staining: purple). The Miller staining was used to delineate the necrotic core (indicated in yellow in [K]).
