Figure 3.

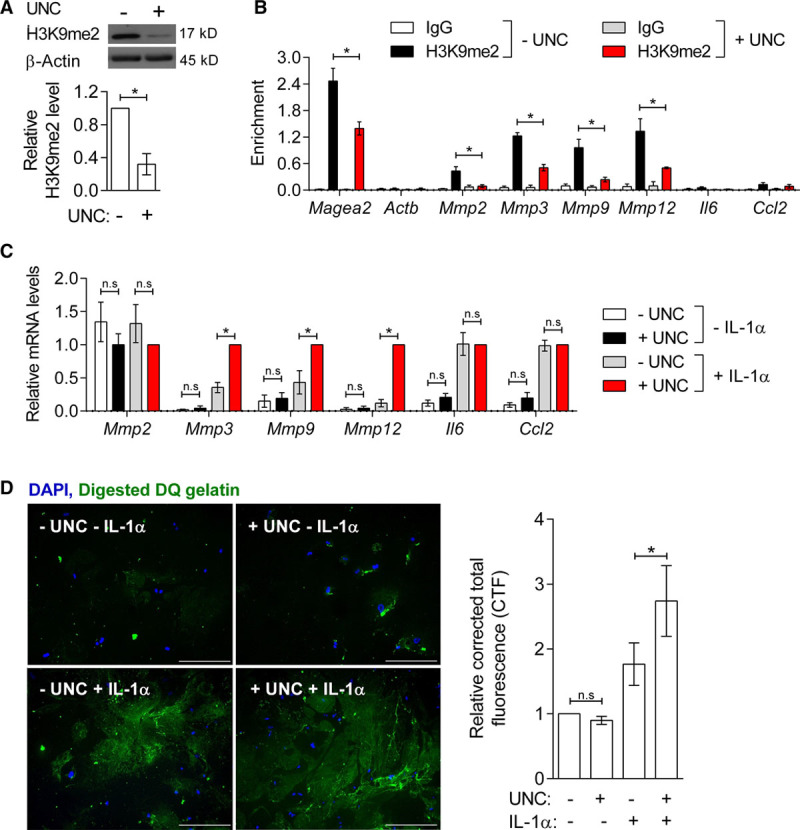
Inhibition of G9A/GLP (G9A-like protein) reduces Histone H3 Lysine 9 Dimethylation (H3K9me2) at MMP (matrix metalloproteinase) gene promoters and potentiates their upregulation in response to IL-1α. A, Representative western blot and quantification of H3K9me2 in UNC (UNC0638)-treated murine vascular smooth muscle cells (mVSMCs; 48 h) relative to controls (–UNC), normalized to β-actin. Graph shows mean±SEM of 4 independent primary cultures. *P<0.05 (Mann-Whitney U test). B, Chromatin immunoprecipitation-qPCR analysis in control and UNC-treated mVSMCs showing H3K9me2 enrichment (mean±SEM of 4 independent primary cultures) at control loci (Magea2, positive and Actb, negative) and the promoters of Mmp2, Mmp3, Mmp9, Mmp12, Il6, and Ccl2 compared with negative control IgG. *P<0.05 (Kruskal-Wallis). C, RT-qPCR (reverse transcription with quantitative polymerase chain reaction) analysis of Mmp2, Mmp3, Mmp9, Mmp12, Il6, and Ccl2 in control (white bars), UNC (black), IL-1α (gray), and IL-1α+UNC-treated (red) mVSMCs. Expression (mean±SEM of 4–5 independent primary cultures) is shown relative to cells treated with UNC+IL-1α (red bars) and normalized to housekeeping genes (Hmbs and Ywhaz). *P<0.05, n.s., not significant (Kruskal-Wallis). D, Representative images and quantification of dye-quenched (DQ)-gelatin digestion in control (top left), UNC (top right), IL-1α (lower left), and UNC+IL-1α-treated mVSMCs (lower right). Signals for digested DQ-gelatin (green) and DAPI (4′,6-diamidino-2-phenylindole)-stained nuclei (blue) are shown. Scale bars, 25 μm. Bar plot shows the corrected total fluorescence (CTF), relative to untreated cells (mean±SEM of 6 independent primary cultures). *P<0.05 (Kruskal-Wallis).
