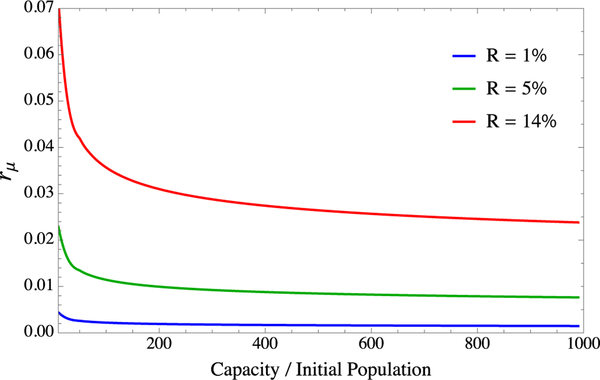
FIG. 5.
Computed values of rμ from the system (2) for different expected steady-state proportions of resistant cells as the availability of resources is varied. Across a wide range of carrying capacities, rμ only varies from ∼0.5% to ∼1.5%. Plots in the main text employ rμ = 0.25%, corresponding to an initial hypermutant population of 1% of the total population.

