Table 2.
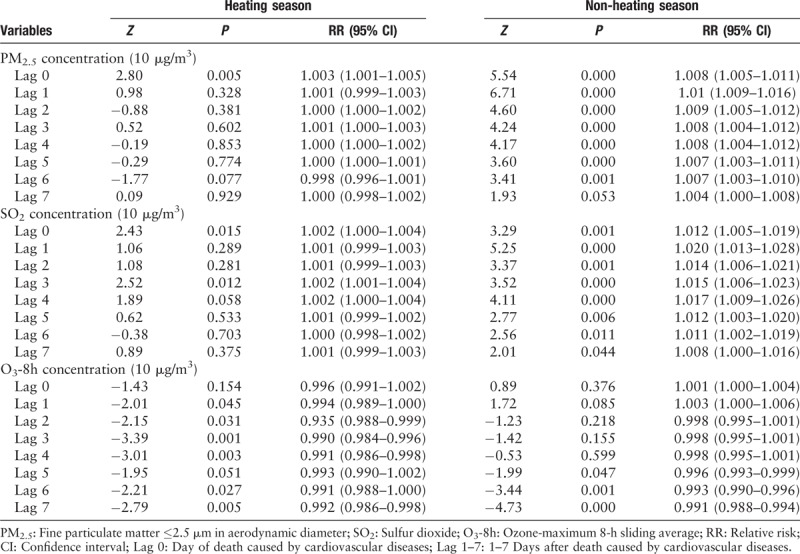
Relationship between cardiovascular diseases and PM2.5, SO2, and O3-8h concentrations during the two seasons in the single-pollutant model in Shenyang from April 2013 to March 2016.

Relationship between cardiovascular diseases and PM2.5, SO2, and O3-8h concentrations during the two seasons in the single-pollutant model in Shenyang from April 2013 to March 2016.
